System Monitoring Dashboard
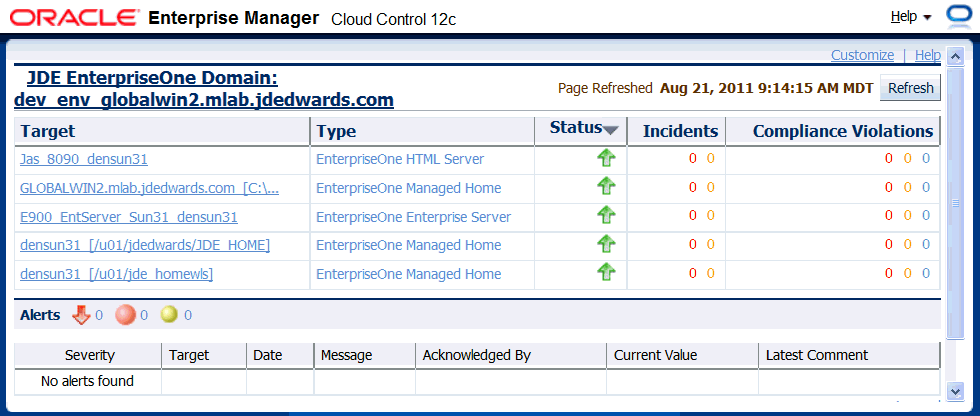
Use the System Dashboard to view the health of managed targets within a group or system in real time. The System Dashboard presents information using intuitive icons and graphics that let you spot recent changes and quickly identify and respond to problems. You can:
Customize the display attributes to match information requirements of managed targets.
Monitor status for recent problems.

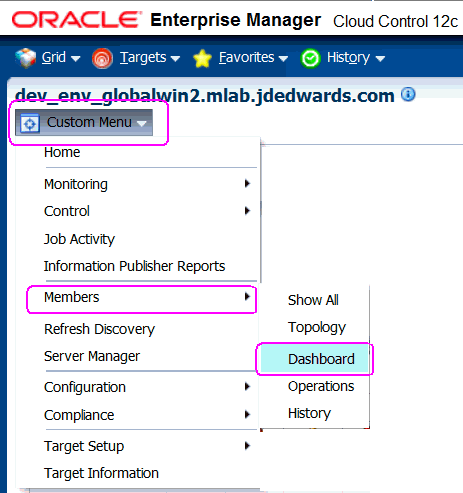
To access the System Monitoring Dashboard, navigate Custom Menu > Members > Dashboard. Below is an example of the dashboard for the JD Edwards EnterpriseOne Domain.
