Get Memory / CPU Diagnostics
The enterprise server process ID page is used to evaluate on-demand diagnostics and has a new section called Diagnostics and Recycling.
The Diagnostics section is only applicable to CallObject Kernels, RUNBATCHprocesses, and Subsystem UBE's.
The diagnostics section allows the collection of the following four types of diagnostics:
Memory diagnostics - Once the User clicks this, the system will write the in-memory EnterpriseOne objects diagnostics data to the EnterpriseOne server process JDEDEBUG log. This should be used to debug EnterpriseOne Object leaks causing EnterpriseOne process memory growth. The diagnostics data has the following structure.
Process OS data
Memory (megabytes)
CPU (percent)
Threads (number of threads)
Memory data
Process level data shared by all user sessions.
1. Environment data
2. JDB Table Cache data
3. Database Connection data
User Sessions
1. Open JDB Transactions
2. Open Tables or Views
3. Open JDECaches
4. Open Data Pointers
CPU Diagnostics - Once the User clicks this, the system will write the in-memory business function call stack(s) to the EnterpriseOne server process JDEDEBUG log (whether or not debug logging has been enabled). This should be used to debug hanging (low CPU) or looping (high CPU) EnterpriseOne processes. The following data will be displayed in the CPU diagnostics.
Process OS data
Memory (megabytes)
CPU (percent)
Threads (number of threads)
CPU Diagnostics
BSFN Call Stacks
1. BSFN call stack for thread 1
2. BSFN call stack for thread 2 (thread BSFN call stacks beyond the first thread are only applicable to CallObject Kernel processes)
3. etc.
OS Call Stacks
1. OS call stack for thread 1
2. OS call stack for thread 2 (thread OS call stacks beyond the first thread are only applicable to CallObject Kernel processes)
3. etc.
All Diagnostics - Once the user clicks this, the system will generate a combination of Memory AND CPU diagnostics. The following data will be displayed in All diagnostics.
Process OS data
Memory (megabytes)
CPU (percent)
Threads (number of threads)
Memory data
Process level data shared by all user sessions.
1. Environment data
2. JDB Table Cache data
3. Database connection data
User Sessions
Open JDB Transactions
Open Tables of Views
Open JDECaches
Open Data Pointers
CPU Diagnostics
BSFN Call Stacks
1. BSFN call stack for thread 1
2. BSFN call stack for thread 2 (thread BSFN call stacks beyond the first thread are only applicable to CallObject Kernel processes)
3. etc.
OS Call Stacks
1. OS call stack for thread 1
2. OS call stack for thread 2 (thread OS call stacks beyond the first thread are only applicable to CallObject Kernel processes)
3. etc.
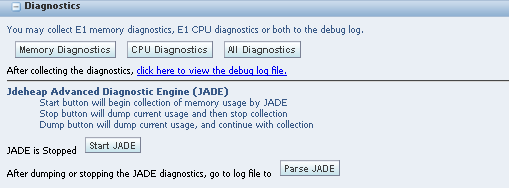
JADE -
Start button will begin collection of memory usage
JADE can be set up statically in jde.ini. The functionality is similar to BMD with levels 1, 2, and 3 available (see advanced Profiling). The default setting is JADE level 2.
Stop button will dump current usage and then stop collection
Dump button will dump current usage and then stop collection
Parse JADE button will bring up the log file after dumping or stopping JADE diagnostics.
After the diagnostics have been collected for Memory Diagnostics, CPU Diagnostics, or All Diagnostics, then click on the click here to view the debug log file link to view the diagnostics.
(Release 9.2.6.0) Here is a sample of All Diagnostics:
Sep 7 13:00:46.002000 - 6116/3768 WRK:eNetKernelLevel3Dump User initiated process dump (All Diagnostics):
********** Begin OS Data **********
Memory Usage = 193MB
CPU Usage = 0%
Number of Threads = 10
********** End OS Data **********
********** Begin Detailed Memory Data **********
********** Begin Process Data **********
ENVIRONMENT,Ptr=0000000008C85980,Env=JDV92WN2,PathCode=DV920,Package=D926PKGB,Latest=FALSE
ENVIRONMENT,Ptr=000000000C521FF0,Env=JDV92WN2,PathCode=DV920,Package=D926PKGA,Latest=TRUE
ENVIRONMENT,Ptr=000000000D084730,Env=DV92WN2,PathCode=DV920,Package=D926PKGA,Latest=TRUE
JDBTABLECACHE,Ptr=0000000009F67680,Name=JDB_BV_1631033875JDV92WN2F0004,#Records=2
JDBTABLECACHE,Ptr=0000000009F67940,Name=JDB_BV_1631033875JDV92WN2F0005,#Records=5
JDBTABLECACHE,Ptr=0000000009DFF0E0,Name=JDB_BV_1631033876JDV92WN2F40039,#Records=1
JDBTABLECACHE,Ptr=0000000009DFF3A0,Name=JDB_BV_1631033876JDV92WN2F4009T1,#Records=1
JDBTABLECACHE,Ptr=000000000C159C90,Name=JDB_BV_1631033876JDV92WN2F4009,#Records=1
JDBTABLECACHE,Ptr=000000000C80F3C0,Name=JDB_BV_1631033876JDV92WN2F40205,#Records=1
JDBTABLECACHE,Ptr=000000000C80F7E0,Name=JDB_BV_1631033876JDV92WN2F7306,#Records=1
JDBTABLECACHE,Ptr=000000000C8109C0,Name=JDB_BV_1631033876JDV92WN2F99410,#Records=8
JDBTABLECACHE,Ptr=000000000A034720,Name=JDB_BV_1631034974JDV92WN2F0004,#Records=1
JDBTABLECACHE,Ptr=000000000A0349E0,Name=JDB_BV_1631034974JDV92WN2F0005,#Records=2
JDBTABLECACHE,Ptr=000000000A01E3C0,Name=JDB_BV_1631034975JDV92WN2F7306,#Records=1
JDBTABLECACHE,Ptr=000000000E4EF8C0,Name=JDB_BV_1631035877DV92WN2F7306,#Records=1
OCIDBCONN,Ptr=000000000A2FD060,DBServer=den60202jems,DBUser=JDE,TNSDB=ems2649,ConnState=AutoInUse,CommitMode=A,RefCount=37,ThreadID=0AgeInSeconds=35.000000
OCIDBCONN,Ptr=000000000A2FE1D0,DBServer=den60202jems,DBUser=TESTDTA,TNSDB=ems2649,ConnState=AutoInUse,CommitMode=A,RefCount=7,ThreadID=0AgeInSeconds=35.000000
OCIDBCONN,Ptr=000000000A300A80,DBServer=den60202jems,DBUser=DV920,TNSDB=ems2649,ConnState=AutoInUse,CommitMode=A,RefCount=13,ThreadID=0AgeInSeconds=35.000000
********** End Process Data **********
********** Begin Session Data **********
SESSION,Ptr=00000000094F82B0,User=USR01,Env=JDV92WN2,Role=*ALL,EnvPtr=0000000008C85980,Machine=den60202jems,SignOnTime= 9/ 7/2021 11:57:56,LastActiveTime= 9/ 7/2021 13:00:09,ThreadedBSFN=0,InlinedBSFN=0
OPENJDBTRANSACTION,Ptr=000000000C417F80,CommitMode=Auto,Owner=InitUser,AppName=(UNKNOWN),File=jdb_ctl.c,Function=JDB_LoadEnv,Line=6296
TABLE,Ptr=000000000A305C70,Name=F9200,CommitStatus=Active,File=jdeddapi.c,Function=CheckAndOpenDDTable,Line=3883
TABLE,Ptr=000000000A308670,Name=F9210,CommitStatus=Active,File=jdeddapi.c,Function=CheckAndOpenDDTable,Line=3947
TABLE,Ptr=000000000D2FAA70,Name=F9203,CommitStatus=Active,File=jdeddapi.c,Function=CheckAndOpenDDTable,Line=3915
TABLE,Ptr=000000000D2F5370,Name=F9207,CommitStatus=Active,File=jdeddapi.c,Function=CheckAndOpenDDTable,Line=3931
OPENJDBTRANSACTION,Ptr=000000000C41DE70,CommitMode=Auto,Owner=InitUser,AppName=(UNKNOWN),File=jdb_ctl.c,Function=CallStartupBusinessFunction,Line=8927
OPENJDBTRANSACTION,Ptr=000000000C41EC00,CommitMode=Auto,Owner=InitUser,AppName=(UNKNOWN),File=jdekinit.c,Function=JDEK_ProcessInitUserRequest,Line=367
OPENJDBTRANSACTION,Ptr=000000000C418D10,CommitMode=Auto,Owner=InitUser,AppName=(UNKNOWN),File=jdekinit.c,Function=JDEK_ProcessInitUserRequest,Line=367
OPENJDBTRANSACTION,Ptr=000000000D8C9560,CommitMode=Auto,Owner=InitUser,AppName=(UNKNOWN),File=jdekinit.c,Function=JDEK_ProcessInitUserRequest,Line=367
JDECACHE,Ptr=000000000E4EE9A0,Name=231DBC09834E4EAE21F1CC9A207A205B918SalesOrderLine,#Cursors=1,#Records=0,#Indices=2,#References=1,File=b4210390.c,Function=IB4210390_InitSalesOrderLine,Line=183
JDECACHE,Ptr=000000000E4ED240,Name=231DBC09834E4EAE21F1CC9A207A205B918SalesOrderHeader,#Cursors=1,#Records=1,#Indices=1,#References=1,File=b4210390.c,Function=IB4210390_InitSalesOrderHeader,Line=121
DATAPOINTER,Ptr=000000000C5E6550,Index=1001,File=b42x0080.c,Function=GetSalesAdvisorDocumentTypes,Line=110
SESSION,Ptr=000000000DD6E990,User=JDE,Env=JDV92WN2,Role=*ALL,EnvPtr=000000000C521FF0,Machine=den60202jems,SignOnTime= 9/ 7/2021 12:32:30,LastActiveTime= 9/ 7/2021 12:32:31,ThreadedBSFN=0,InlinedBSFN=0
OPENJDBTRANSACTION,Ptr=000000000D8C4400,CommitMode=Auto,Owner=InitUser,AppName=(UNKNOWN),File=jdb_ctl.c,Function=JDB_LoadEnv,Line=6296
OPENJDBTRANSACTION,Ptr=000000000D8CB080,CommitMode=Auto,Owner=InitUser,AppName=(UNKNOWN),File=jdb_ctl.c,Function=CallStartupBusinessFunction,Line=8927
OPENJDBTRANSACTION,Ptr=000000000D8C7A40,CommitMode=Auto,Owner=InitUser,AppName=(UNKNOWN),File=jdekinit.c,Function=JDEK_ProcessInitUserRequest,Line=367
SESSION,Ptr=000000000DA0CFB0,User=JDE,Env=JDV92WN2,Role=*ALL,EnvPtr=000000000C521FF0,Machine=den60202jems,SignOnTime= 9/
7/2021 12:30:57,LastActiveTime= 9/ 7/2021 12:30:58,ThreadedBSFN=0,InlinedBSFN=0
OPENJDBTRANSACTION,Ptr=000000000C41D0E0,CommitMode=Auto,Owner=InitUser,AppName=(UNKNOWN),File=jdb_ctl.c,Function=JDB_LoadEnv,Line=6296
OPENJDBTRANSACTION,Ptr=000000000C41C350,CommitMode=Auto,Owner=InitUser,AppName=(UNKNOWN),File=jdb_ctl.c,Function=CallStartupBusinessFunction,Line=8927
OPENJDBTRANSACTION,Ptr=000000000D8C6CB0,CommitMode=Auto,Owner=InitUser,AppName=(UNKNOWN),File=jdekinit.c,Function=JDEK_ProcessInitUserRequest,Line=367
********** End Session Data **********
********** End Detailed Memory Data **********
********** Begin Detailed CPU Data **********
********** Begin BSFN Call Stacks **********
No BSFN Call Stack ********** End BSFN Call Stacks **********
********** Begin OS Call Stacks **********
=====Call stack of thread 3768=====
GetNTProcessCallStack! C:\JDEdwards\E920\system\bin64\jdel.dll
allocCallStackWindows! C:\JDEdwards\E920\system\bin64\jdel.dll
jdeAllocCallStack! C:\JDEdwards\E920\system\bin64\jdel.dll
logProcessDumpData! C:\JDEdwards\E920\system\bin64\jdekrnl.dll
ProcessLevel3DataDump! C:\JDEdwards\E920\system\bin64\jdekrnl.dll
JDEK_DispatchCallObjectMessage! C:\JDEdwards\E920\system\bin64\jdekrnl.dll
XMLCallObjectDispatch! C:\JDEdwards\E920\system\bin64\XMLCallObj.dll
=====Call stack of thread 7356=====
NtDelayExecution! C:\Windows\SYSTEM32\ntdll.dll
0x7ffa8fd998c1.<nosymbols>! C:\Windows\System32\KERNELBASE.dll
0x7ffa78da7028.<nosymbols>! C:\app\client\product\19.0.0\client_1\bin\OraClient19.Dll
0x7ffa7994e0a0.<nosymbols>! C:\app\client\product\19.0.0\client_1\bin\oracore19.dll
0x7ffa90497974.<nosymbols>! C:\Windows\System32\KERNEL32.DLL
=====Call stack of thread 6548=====
NtWaitForMultipleObjects! C:\Windows\SYSTEM32\ntdll.dll
0x7ffa8fdbd5ee.<nosymbols>! C:\Windows\System32\KERNELBASE.dll
0x7ffa8fdbd4de.<nosymbols>! C:\Windows\System32\KERNELBASE.dll
psthread_cond_wait! C:\JDEdwards\E920\system\bin64\psthread.dll
=====Call stack of thread 7528=====
NtWaitForMultipleObjects! C:\Windows\SYSTEM32\ntdll.dll
0x7ffa8fdbd5ee.<nosymbols>! C:\Windows\System32\KERNELBASE.dll
0x7ffa8fdbd4de.<nosymbols>! C:\Windows\System32\KERNELBASE.dll
psthread_cond_wait! C:\JDEdwards\E920\system\bin64\psthread.dll
=====Call stack of thread 1464=====
NtWaitForMultipleObjects! C:\Windows\SYSTEM32\ntdll.dll
0x7ffa8fdbd5ee.<nosymbols>! C:\Windows\System32\KERNELBASE.dll
0x7ffa8fdbd4de.<nosymbols>! C:\Windows\System32\KERNELBASE.dll
psthread_cond_wait! C:\JDEdwards\E920\system\bin64\psthread.dll
=====Call stack of thread 7780=====
NtWaitForMultipleObjects! C:\Windows\SYSTEM32\ntdll.dll
0x7ffa8fdbd5ee.<nosymbols>! C:\Windows\System32\KERNELBASE.dll
0x7ffa8fdbd4de.<nosymbols>! C:\Windows\System32\KERNELBASE.dll
psthread_cond_wait! C:\JDEdwards\E920\system\bin64\psthread.dll
=====Call stack of thread 5724=====
NtWaitForMultipleObjects! C:\Windows\SYSTEM32\ntdll.dll
0x7ffa8fdbd5ee.<nosymbols>! C:\Windows\System32\KERNELBASE.dll
0x7ffa8fdbd4de.<nosymbols>! C:\Windows\System32\KERNELBASE.dll
psthread_cond_wait! C:\JDEdwards\E920\system\bin64\psthread.dll
=====Call stack of thread 4352=====
NtWaitForMultipleObjects! C:\Windows\SYSTEM32\ntdll.dll
0x7ffa8fdbd5ee.<nosymbols>! C:\Windows\System32\KERNELBASE.dll
0x7ffa8fdbd4de.<nosymbols>! C:\Windows\System32\KERNELBASE.dll
psthread_cond_wait! C:\JDEdwards\E920\system\bin64\psthread.dll
=====Call stack of thread 2868=====
NtWaitForMultipleObjects! C:\Windows\SYSTEM32\ntdll.dll
0x7ffa8fdbd5ee.<nosymbols>! C:\Windows\System32\KERNELBASE.dll
0x7ffa8fdbd4de.<nosymbols>! C:\Windows\System32\KERNELBASE.dll
psthread_cond_wait! C:\JDEdwards\E920\system\bin64\psthread.dll
=====Call stack of thread 7584=====
NtWaitForMultipleObjects! C:\Windows\SYSTEM32\ntdll.dll
0x7ffa8fdbd5ee.<nosymbols>! C:\Windows\System32\KERNELBASE.dll
0x7ffa8fdbd4de.<nosymbols>! C:\Windows\System32\KERNELBASE.dll
receiveMessage! C:\JDEdwards\E920\system\bin64\jdeipc.dll
********** End OS Call Stacks **********
********** End Detailed CPU Data **********