Use Case2
If a running process, such as RunBatch, has a runaway memory leak:
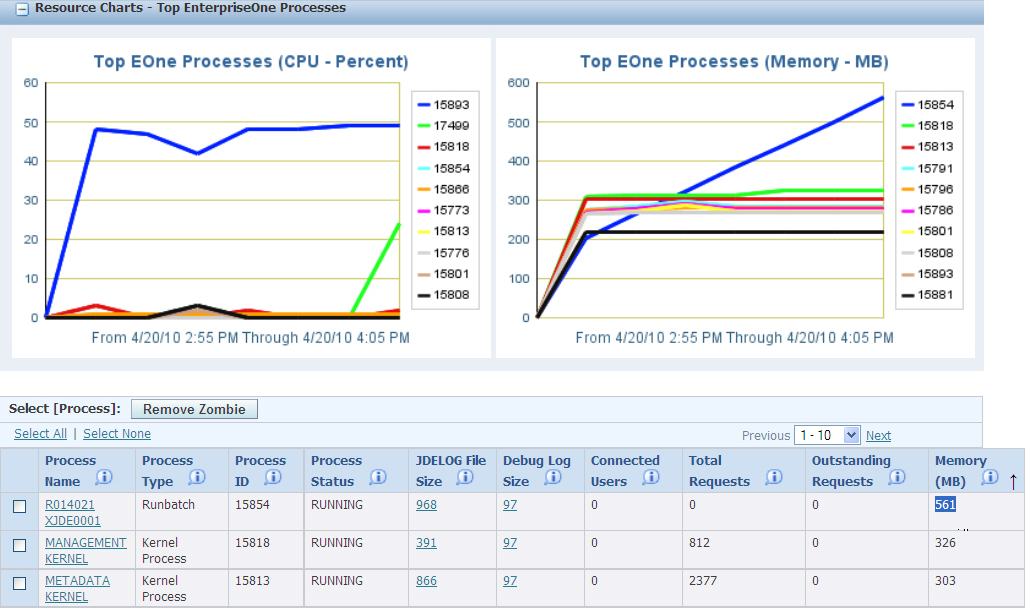
Drill into the known process.
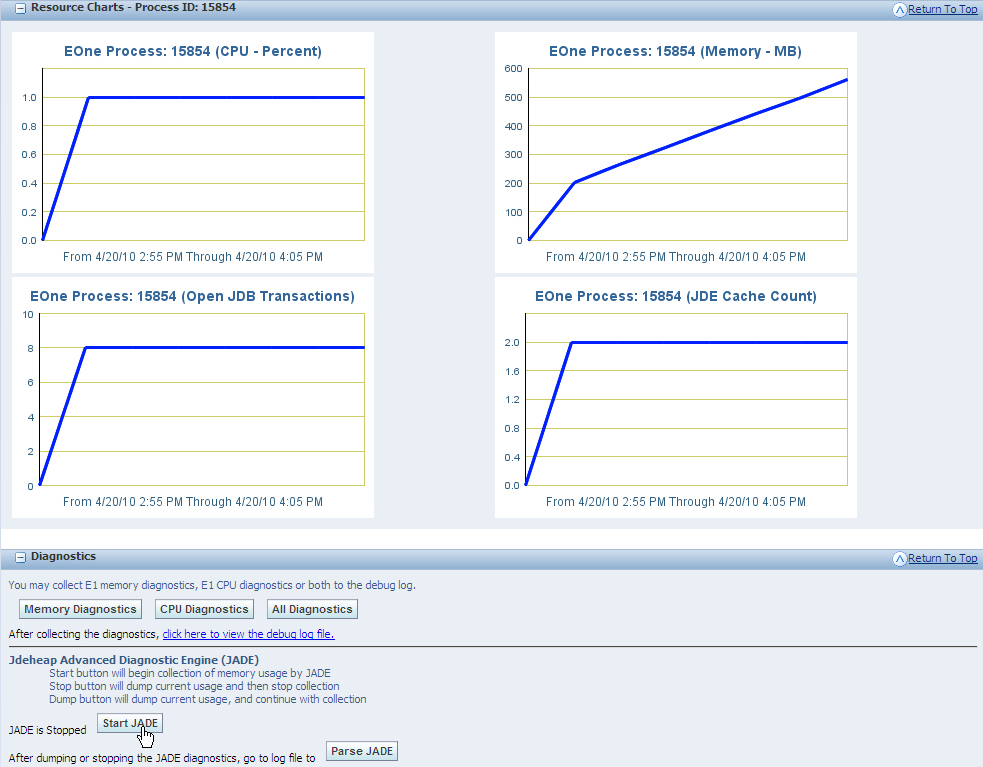
Enable JADE by pressing on "Start JADE".
Let the process run for representative period of leak.
Press "Stop JADE" Button.
Click "Parse JADE" to see the possible leak locations.
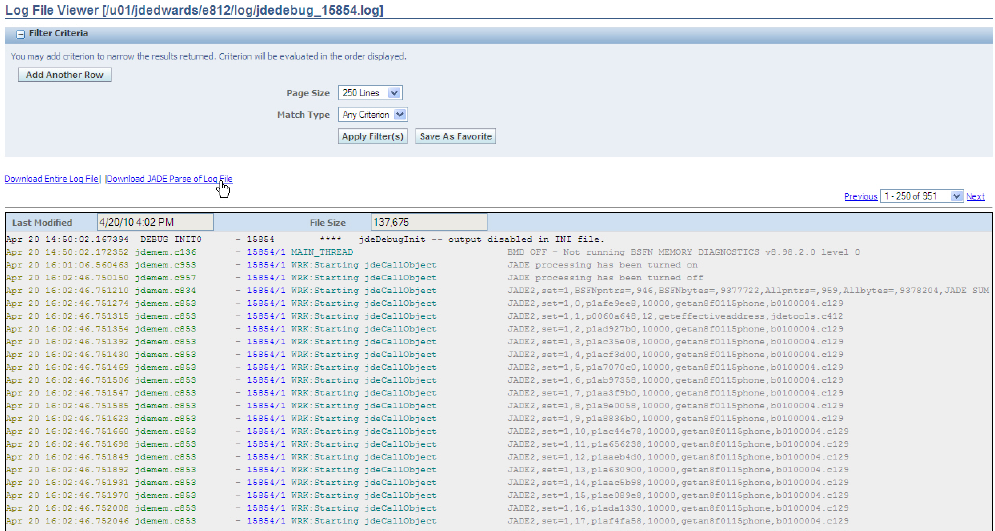
Download JADE Parse file.
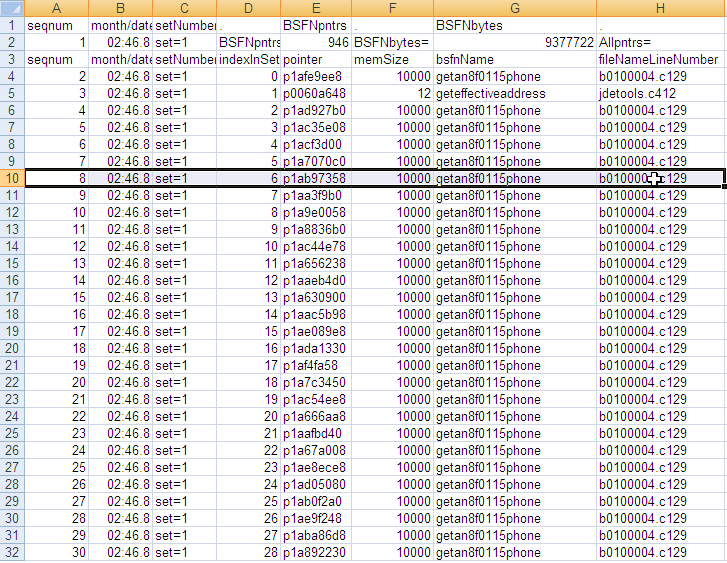
Open the downloaded Parse file in favorite CSV reader and analyze memory allocation patterns which may suggest the location of the leaks.