UX One: Maint Team Cost Performance Page
The Maint Team Cost Performance page (P13002X|W13002XD) enables maintenance managers to view overall cost performance data for their assets and equipment. THe page provides a snapshot of current costs, cost variances, and budget amounts as compared to actual amounts. The page also enables users to easily access programs they need to maintain or update equipment cost data.
To access the UX One Maint Team Cost Performance page, log in to the EnterpriseOne system using the Maintenance Manager role. When you log in with this role, the system automatically displays the Maintenance Manager page. Click the Maint Team Cost Performance task on the springboard to access the Maint Team Cost Performance page.
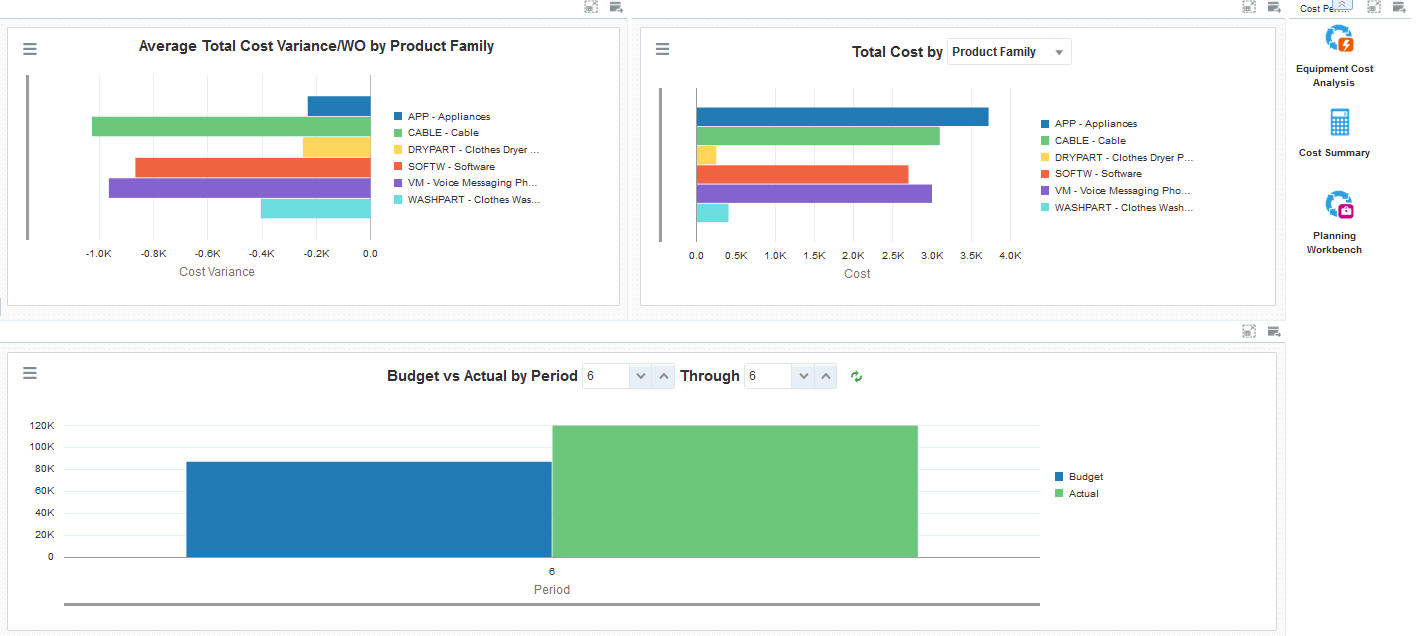
This graphic illustrates the Maint Team Cost Performance page:
Charts
These charts are based on EnterpriseOne programs. By default, the charts are set up to render using queries that are based on delivered demo data. Each of these queries is associated with a specific program version. To use a different query or call a different program version, you can modify these queries or create new queries that better meet your requirements.
This table lists and describes the charts that are available on the Maint Team Cost Performance page:
Chart |
Description |
|---|---|
Average Total Cost Variance/WO by Product Family (P13560X|W13560XN) |
Use this chart to view the average total cost variance by product family. This chart is based on the One View Equipment Work Order Analysis Inquiry program (P13560). |
Total Cost (P13560X|W13560XG) |
Use this chart to view the total cost of work orders. This chart is based on the One View Equipment Work Order Analysis Inquiry program (P13560). Additionally, you can use the drop-down menu at the top of the chart to change the data that the system displays. You can select one of these options:
|
Budget vs Actual by Period (P09217X|W09217XD) |
Use this chart to view budgeted and actual amounts for selected periods. This chart is based on the One View Account Balance Inquiry program (P09217). Additionally, you can use the fields at the top of the chart to specify your period range. |
For additional information about the programs associated with these charts, see these topics in the JD Edwards EnterpriseOne Applications One View Reporting User Guide:
Springboard Tasks
You use tasks to access EnterpriseOne programs and other UX One pages. These tasks are included in a springboard on the page.
This table lists and describes the tasks on the Maint Team Cost Performance page:
Task |
Description |
|---|---|
Equipment Cost Analysis |
Use this task to access the Equipment Cost Analysis program (P13801, version ZJDE0001). When you click the task, the system takes you to the Equipment Cost Analysis - Work with Equipment Cost Analysis form. |
Cost Summary |
Use this task to access the Cost Summary program (P122101, version ZJDE0001). When you click this task, the system takes you to the Cost Summary - Work With Cost Summary form. |
Planning Workbench |
Use this task to access the Planning Workbench program (P13700, version ZJDE0001). When you click this task, the system takes you to the Planning Workbench - Search for Equipment Work Orders form. |
For additional information about the programs accessed by these tasks, see:
Setting Up Equipment Cost Analysis in the JD Edwards EnterpriseOne Applications Equipment Cost Analysis Implementation Guide
Reviewing Asset and Maintenance Costs in the JD Edwards EnterpriseOne Applications Fixed Assets Implementation Guide