UX One: Maintenance Downtime Page
The Maintenance Downtime page (P13005X|W13005XC) enables maintenance schedulers to receive notification alerts about unassigned emergency and maintenance repairs, analyze data related to maintenance downtime, and access related applications to take any required action.
To access the UX One Maintenance Downtime page, log in to the EnterpriseOne system using the Maintenance Scheduler role. When you log in with this role, the system automatically displays the Maintenance Scheduler page. Click the Maintenance Downtime task on the springboard to access the Maintenance Downtime page.
This graphic illustrates the Maintenance Downtime page:
Watchlist Alerts
The watchlist alerts on the Maintenance Downtime page are the same as the watchlist alerts on the Maintenance Scheduler page. See "Watchlist Alerts" for the Maintenance Scheduler page.
Charts
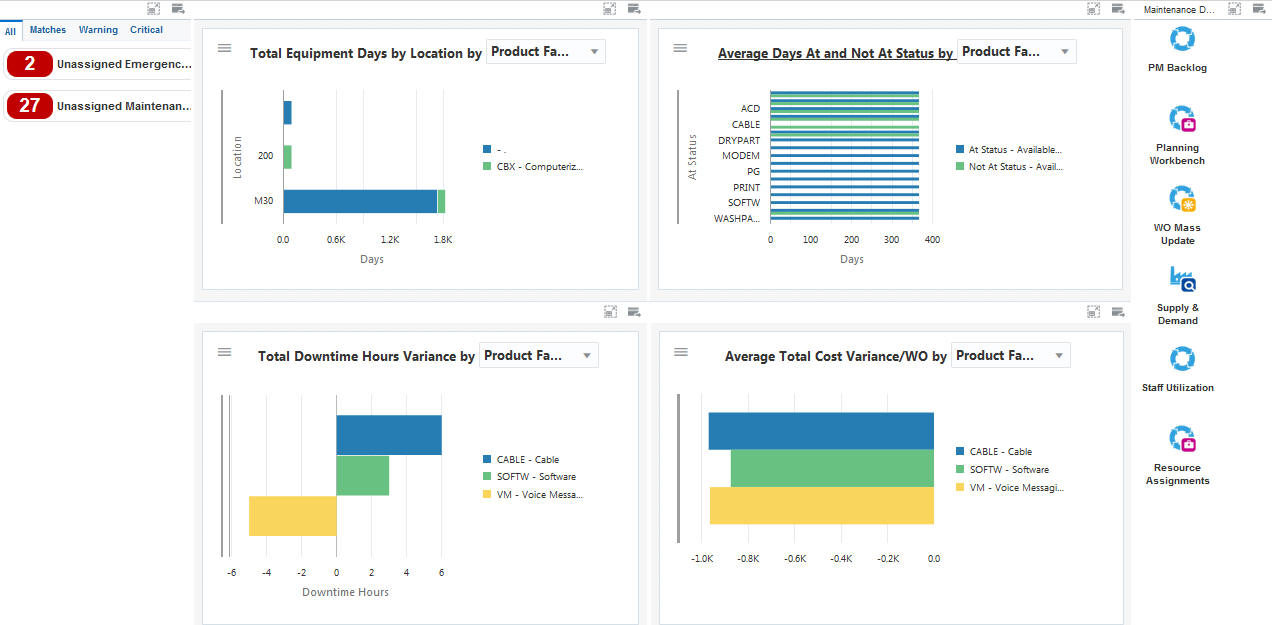
These charts are based on EnterpriseOne programs. By default, the charts are set up to render using queries that are based on delivered demo data. Each of these queries is associated with a specific program version. To use a different query or call a different program version, you can modify these queries or create new queries that better meet your requirements.
This table lists and describes the charts that are available on the Maintenance Downtime page:
Component Title |
Description |
|---|---|
Total Equipment Days by Location (P13230X|W13230XA) |
Use this chart to view the total number of days that an equipment is at each location. This chart is based on the One View Equipment Location Inquiry program (P13230). Additionally, you can use the drop-down menu on the top of the chart to change the data that the system displays. You can select one of these options:
|
Average Days At and Not At Status (P13400X|W13400XA) |
Use this chart to analyze the status history for a piece of equipment. This chart is based on the One View Equipment Status Inquiry program (P13400). Additionally, you can use the drop-down menu on the top of the chart to change the data that the system displays. You can select one of these options:
|
Total Downtime Hours Variance (P13560X|W13560XI) |
Use this chart to view the total downtime hours variance based on the assignee, equipment, product family, or product model. This chart is based on the One View Work Order Analysis program (P13560). Additionally, you can use the drop-down menu on the top of the chart to change the data that the system displays. You can select one of these options:
|
Average Total Cost Variance/WO (P13560X|W13560XF) |
Use this chart to view the average total cost variance for your work orders based on the product family or site. This chart is based on the One View Work Order Analysis program (P13560). Additionally, you can use the drop-down menu on the top of the chart to change the data that the system displays. You can select one of these options:
|
For additional information about the programs associated with these charts, see these topics in the JD Edwards EnterpriseOne Applications One View Reporting User Guide:
Springboard Tasks
The springboard tasks on the Maintenance Load page are the same as the tasks on the Maintenance Scheduler page. See "Springboard Tasks" for the Maintenance Scheduler page.