Understanding the Run Details Tab
- Notification input and output, subscriber details, subscriber input and output, and so on for notifications that are enabled for monitoring.
- Orchestration input and output and step details for orchestrations that are enabled for monitoring.
- REST service details.
The default view in the Run Details tab of the Orchestrator Monitor displays high-level information about the name, duration, status and so on. Expand each row to find additional run details.
High-Level Run Details Information
The Run Details tab displays the following high-level information:
-
Request Received
This is the date and time when the monitoring request was received.
-
Name
This is the name of the UDO as given by the creator of the UDO. The icon next to it indicates if it is an orchestration
 or notification
  or a
or a  REST service.
 -
Status
Displays the status as Running, Queued, Successful, Failed, Warning, or Successful Some Steps Failed.
-
Duration(ms)
This is the run time duration of the UDO displayed in milliseconds.
-
User
This is the name for the user.
-
Environment
The environment in which the UDO was processed.
-
Product Code
The product code associated with the UDO.
Detailed Monitoring Information
Additional details may be displayed based on the settings in the Monitoring section of the Run Options window. Expand a row to view the following additional details:
-
UDO Name
This is the ID of the UDO in EnterpriseOne.
-
Host Address
This is the IP address of the host machine.
-
Host Name
This is the name of the host machine.
-
Status
Displays the status as Running, Queued, Successful, Failed, Warning, or Successful Some Steps Failed. Click the More Details button next to the Status field, to view the input and output details in the JSON format.
-
URL
-
Type
This is the UDO type. The system displays if the UDO is an orchestration, notification, or a REST service.
-
Duration
This is the run time duration of the UDO displayed in seconds.
-
Run Id
-
Response Code
This is the HTTP response code to indicate how server responded to the client's request.
-
Queue
The system displays a bar chart with details for each step if you are tracking the steps of the orchestration. The steps that are processed successfully are displayed in green and the failed steps are displayed in red. You can hover over the bar chart to view more information about a particular step.
Click the + and - icons to zoom in or zoom out the longer steps. Hover over each step to review more details.
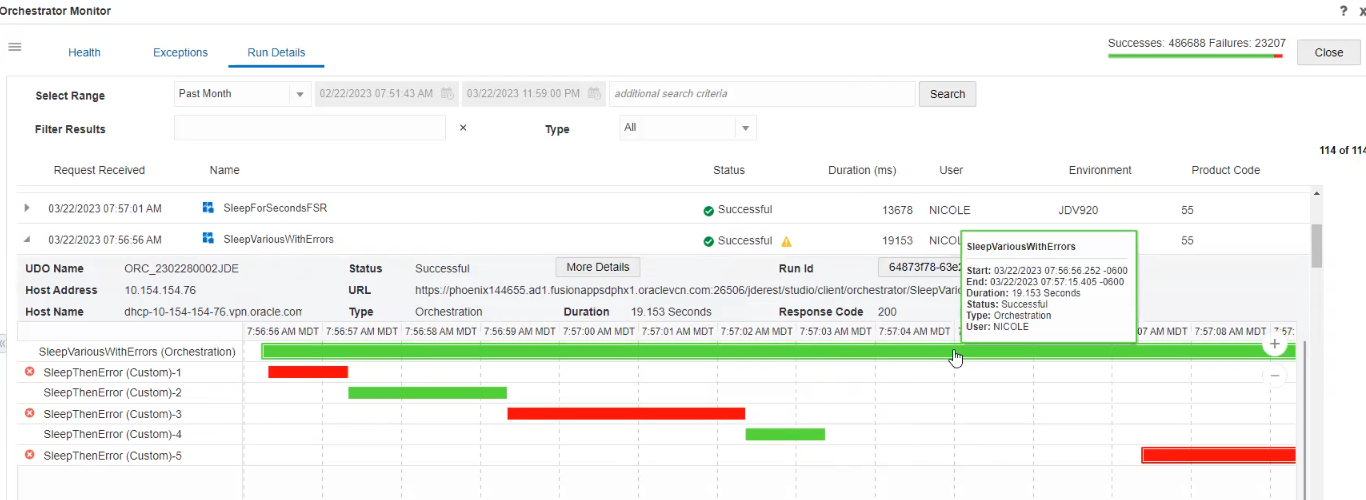
If the Step Input/Output option is selected for monitoring an orchestration, the system records the input and output of each orchestration step. When you click the individual bar, the system displays a window with input and output values in the JSON format.