Working with the Graphical Representation of an Orchestration
The following figure provides a graphical representation of an orchestration with all its components. The orchestration is represented in a flowchart enabling you to easily understand the orchestration flow. Each component in the orchestration is represented by a unique icon.
Orchestrations Page
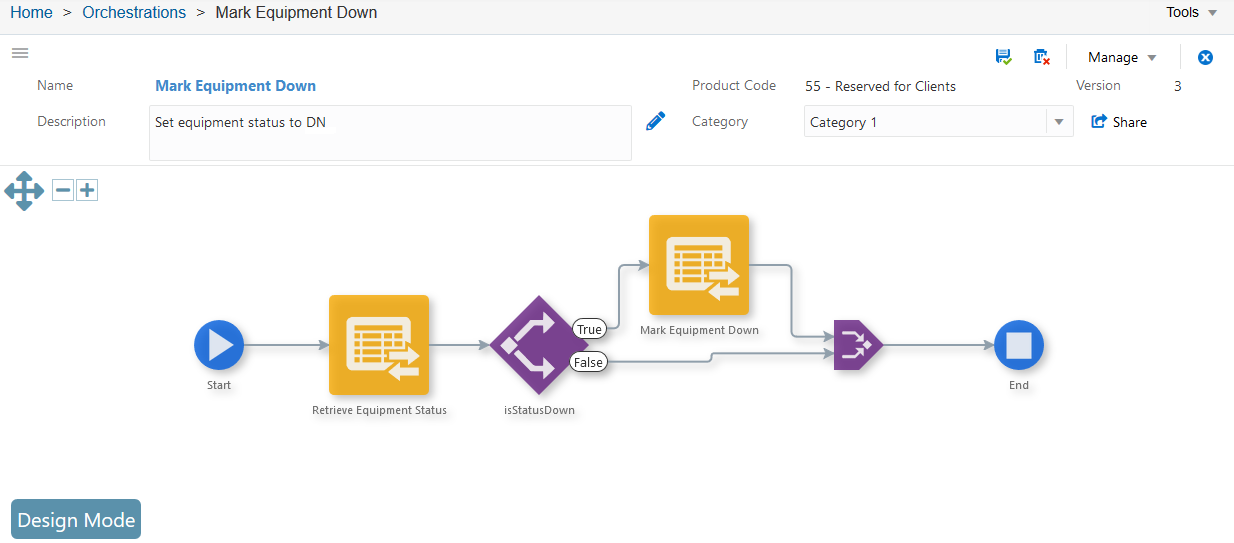
The canvas includes the following features:
Zoom to Fit
The Zoom to Fit icon in the upper-left corner of the canvas enables you to view the entire graphical representation in the window. This functionality helps users to view complex orchestrations that contain multiple components.
Alternatively, you can double-click the canvas to fit the entire orchestration flow within the graphic area. This option positions the orchestration flow in the center of the canvas.
Zoom in or Zoom out
The Zoom in or Zoom out icons in the canvas enable you to zoom in to get a close-up view of the orchestration or zoom out to view the orchestration in reduced size.
Start and End Steps
Start and End are the pseudo steps that are not part of the orchestration but enable you to add components in between them.
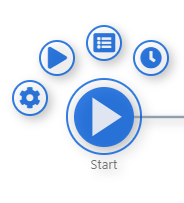
When you click the Start node in the orchestration flow, action control icons are displayed at the top of the Start node.
The following figure shows the action control items that are displayed when you click the Start node.
Start Node
Run Options (Release 9.2.7.4). Opens the Run Options window. You can define your Job Queue settings and orchestration monitoring requirements such as input and output information, step details, step input and output, and other run options by using this window.
Indicator Icons
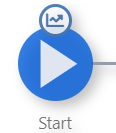
Monitoring icon
The following icon is displayed when monitoring is enabled for the orchestration:
The following icons show the indicator images that are displayed on the orchestration steps representing the job queue of the orchestration:
Fire and Forget icon
The Fire and Forget icon indicates that the job runs in a fire and forget queue.
Stack icon
The Stack icon indicates that the job runs in a single-threaded queue.
Stateful icon (Release 9.2.8.3)
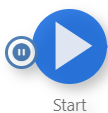
The pause icon indicates that the orchestration is defined as Stateful.
Run Orchestration. Takes you to the Run Orchestrations page to test only the current orchestration. You can click the Run Orchestrations icon on the Orchestrator Studio Home page to test all the other personal or shared orchestrations.
Inputs and Values. Opens Inputs and Values dialog box to add inputs that the orchestration consumes from a calling custom program, a third-party application, or a Cloud service.
Schedule. Takes you to the Schedule page to assign a schedule to the orchestration.
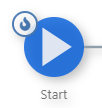
In the figure below, a Schedule icon on the Start node indicates that the orchestration has an attached schedule.
Schedule

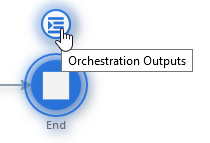
When you click the End icon in the orchestration flow, the following action control icon is displayed at the top of the End node:
Orchestration Outputs. Takes you to the Orchestration Output page to validate the fields that contain the data you want returned in the orchestration output for output mapping.
The following figure shows the action control item that are displayed when you click the End node.
End Node
Informational hover help
Hover your mouse over a component in the graphical area to view information about the component. You can find the type of component, component name, description, and product code. Depending on the type of component, you can view other details such as match criteria for a rule and subject and body details for a message.
-
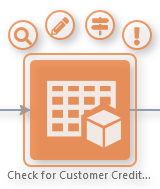
Action control items
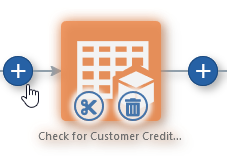
When you click a box that represents a component, the action control icons are displayed at the top of the box. You can use these action control icons to map a step, edit component, configure transformation, and define error handling.
The following figure shows the action control items that are displayed when you click the any box representing a component in an orchestration.
Action Control icons
-
Choose Step. Takes you to the component side panel dialog box to choose the component that you want to add to the orchestration flow. The component side panel dialog box displays only those items that are related to the component that you have chosen to include. You can also create a new component item from this dialog box. Broken mapping is indicated by
 icon on the component box.
 -
Edit. Takes you to the design page for modifying a particular component. Alternatively, you can double-click the box representing a component to access the design page for editing the component.
Note:The Edit icon is disabled if you have added a local orchestration directly as a step in the orchestration flow. (Release 9.2.4.3)
-
Transformations. Map orchestration inputs to inputs that are defined in each orchestration component.
The following example shows the Iterate Over icon on the box that represents a component in the orchestration. The Iterate Over icon indicates that you want to pass a data set that is retrieved from a form request or data request to a subsequent orchestration step. See Passing a Data Set to a Subsequent Orchestration Step for more information.
Iterate and Fire and Forget icons
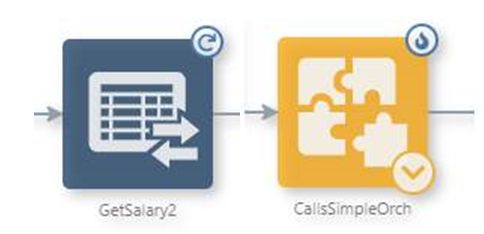
This fire and forget indicator applies to notification and orchestration steps only and indicates that the individual steps execute asynchronously (on their own thread). If both the iterate and fire and forget options are selected for a step, then the step is submitted to its own queue with the maximum number of threads configured for it.
-
Error Handling. Set up error handling for each orchestration component.
Broken mapping is indicated by
icon on the component box. A broken mapping can exist in
Transformations and Error Handling. When you open the Transformations and the
Error Handling dialog boxes, the Broken Mapping icon is displayed against the
rows where the break exists. -
Design Mode
Add icon. Click the Design Mode button to add components to the orchestration by clicking the plus sign (+) in the orchestration path.
Design Mode
Alternatively, you can double-click the arrow in the orchestration path to add a component to the orchestration.
Remove Step. Removes the component from the orchestration.
Cut Element. Move component within an orchestration. You can paste the component at any location within the orchestration by clicking the Paste Element icon displayed in the orchestration path.