Viewing Exceptions in the Chart View
Use the Chart view to display exception data visually in a chart. The bottom of the page provides options to display the data in a pie chart or a vertical, horizontal, stacked, or unstacked bar chart.
In the Chart view, you can display information by UDO name, exception, or application error. The key to the right of the chart changes to identify the data represented in the chart. The following image shows an example of exceptions displayed in a vertical bar chart.
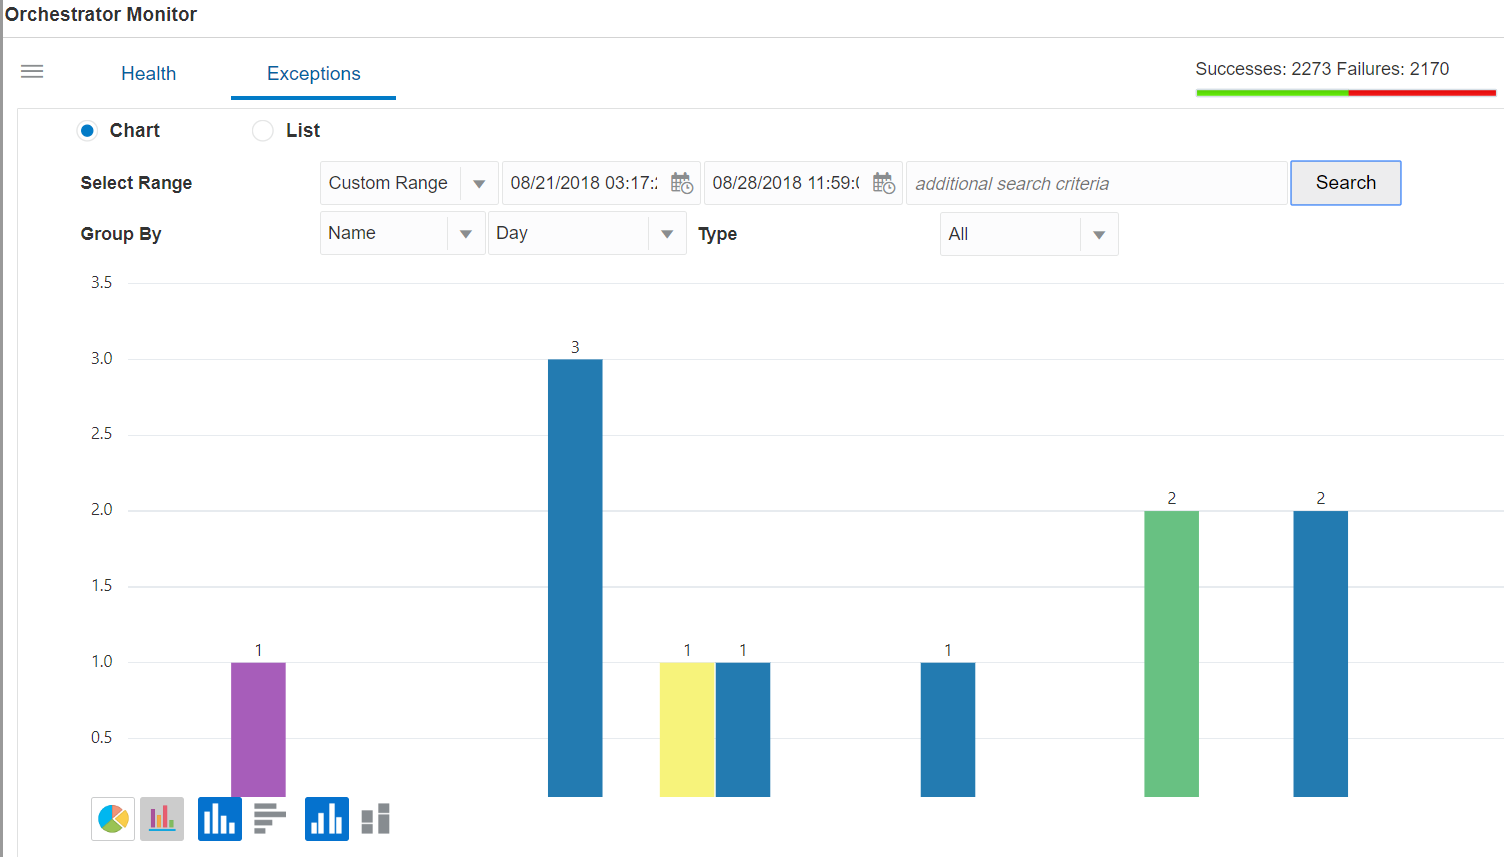
Each bar or section in a pie chart displays a number related to the data you selected to display. If grouping data by UDO name, the number represents the number of exceptions for the UDO. If grouping data by exception, the number represents the number of times the exception occurred. If grouping data by application error, the number represents the number of times the application error occurred.