Analyzing Snapshots Using the Snapshot Analysis Pane (Tools Release 9.2.26.2)
You can right-click a node or link, then select Analyze Snapshots to open the snapshot analysis pane at the top of the window. The pane displays bar charts along with the snapshot data that you can use to review, analyze, and compare processes.
You can analyze a node or a link metric of an enterprise process in the Snapshot Analysis pane. When you select Analyze Snapshots for a node, the pane displays the selected node metric for that node across the snapshots. When you select Analyze Snapshots for a link, the pane displays the selected link metric for that link across the snapshots.
When the Snapshot Analysis pane is open, the UDO Manager, Snapshot Manager, and Compare View are hidden.
To analyze snapshots:
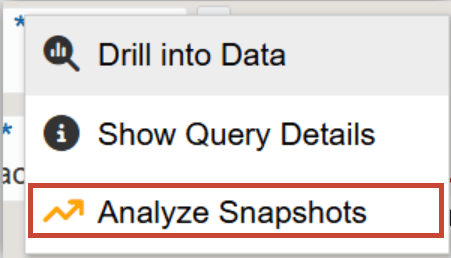
- Right-click a node or link and click Analyze Snapshots.Note: The Analyze Snapshots option is disabled when no snapshots are available for the selected enterprise process.
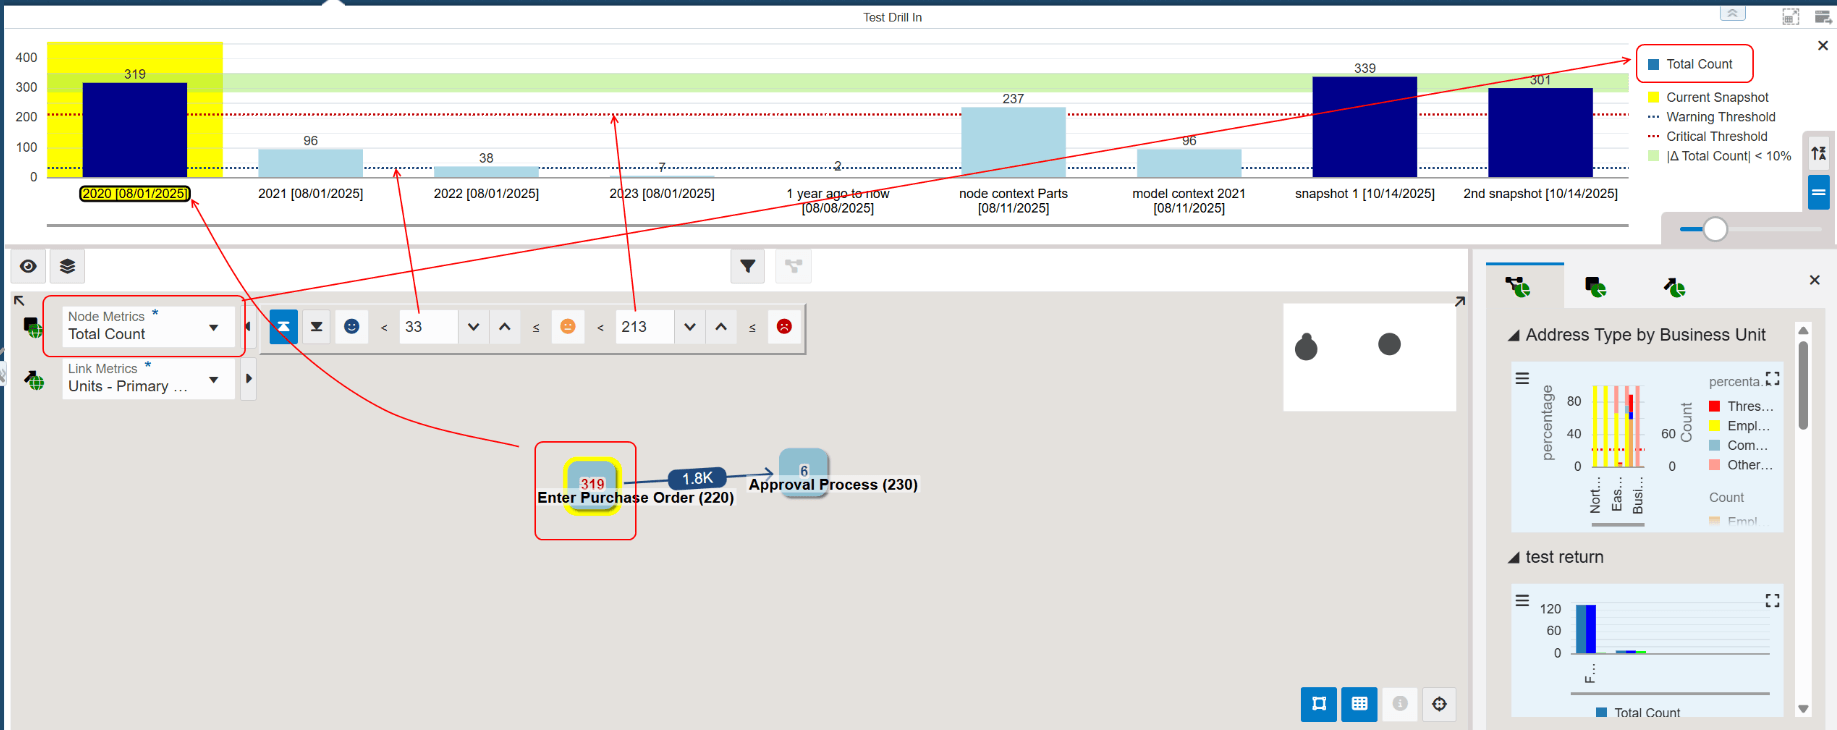
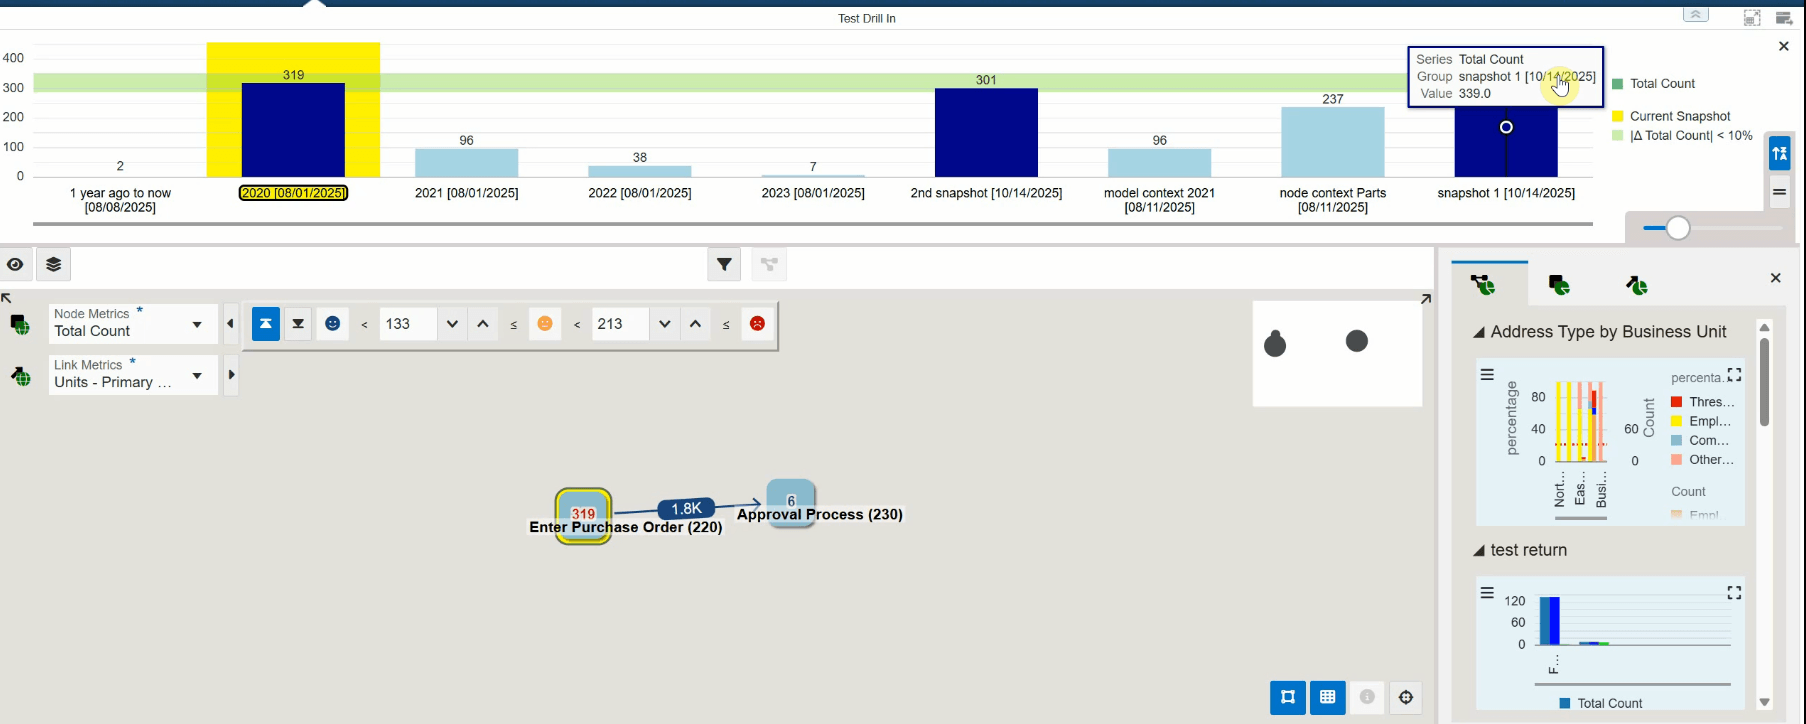
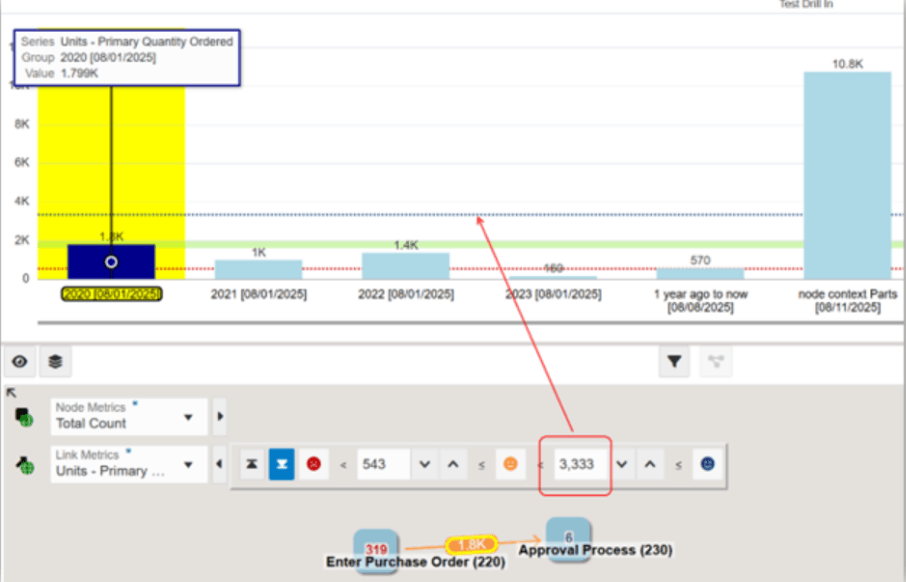
In the snapshot analysis pane, data for the selected node or link appears across snapshots. Hover over a bar in the chart to review the following:
-
Series: Indicates the metric name that the chart displays (for example, Total Count). The Series matches the metric you selected in Node Metrics or Link Metrics.
-
Groups: Indicates the snapshot name and snapshot date. The currently selected group is highlighted in yellow.
-
Values: Displays the metric value for the selected node or link metric.
 Note: The snapshot analysis pane displays bar charts only. You can resize it vertically, drag the horizontal bar located at the bottom edge of the pane (between the snapshot analysis pane and the model pane) to your preferred height.
-
-
Click a bar or a group label to open the corresponding snapshot in the model pane.
Use Switch threshold lines to show (default)
 or hide
  threshold lines. When enabled, the chart displays two threshold lines
in different colors (red and blue) based on the settings in the Threshold
Configurator of a node or a link in the currently open snapshot.
threshold lines. When enabled, the chart displays two threshold lines
in different colors (red and blue) based on the settings in the Threshold
Configurator of a node or a link in the currently open snapshot.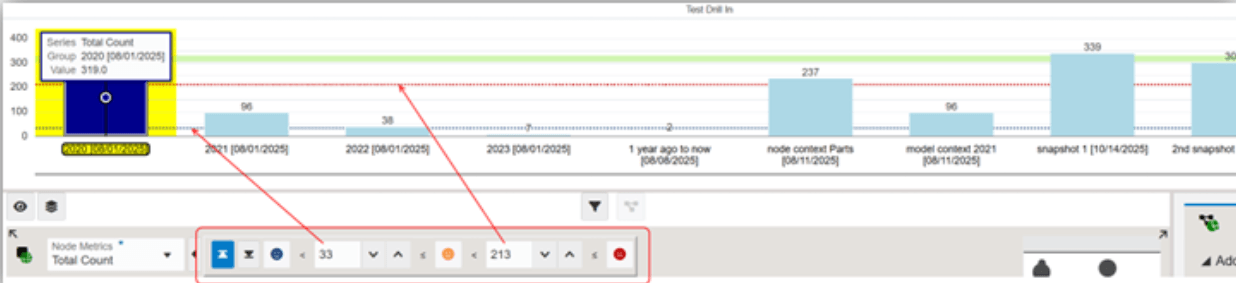
-
Use Switch sorting to sort groups by Label
 or Creation Time
  .
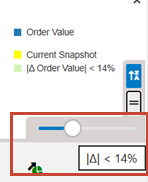
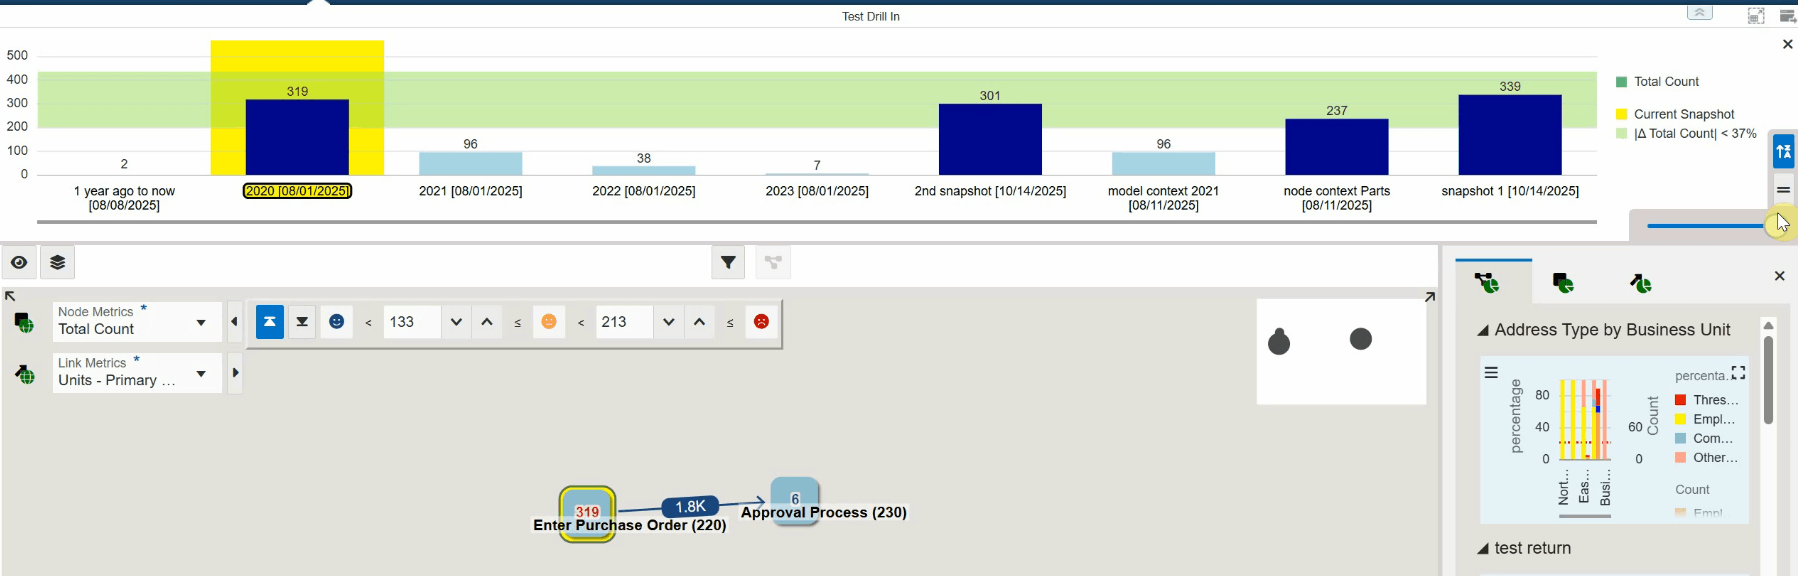
. Move the percentage threshold slider (0%–40%) to set the percentage and display the corresponding reference area on the chart for the selected node or link metrics.
In the following example, The Enter Purchase Order node is selected in the model pane and Total Count is selected in Node Metrics. The reference area for Total Count is represented by the green horizontal bar on the snapshot analysis pane.
In the following example, the percentage threshold slider (0%–40%), is set to 37% and the Order Count reference area is increased in the snapshot analysis pane (represented by the green horizontal bar).
-
In the model pane, select different metrics and thresholds, then compare and analyze the results in the snapshot analysis pane.
- The chart in the snapshot analysis pane updates to reflect the metrics
selected in the model pane.
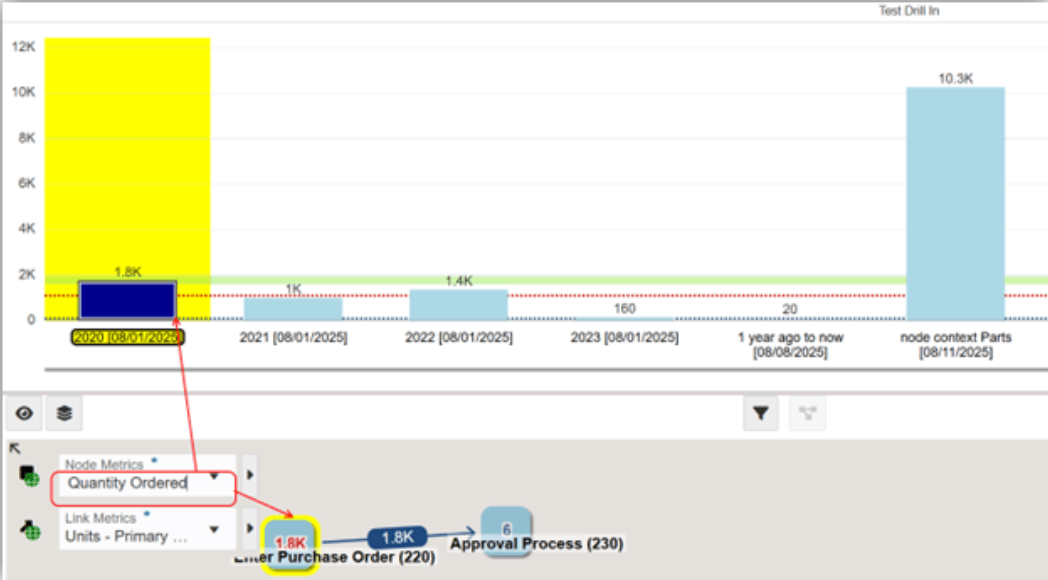
Select another node or link to analyze a different item. The system moves the yellow outline to the newly selected item and refreshes the chart for that item.
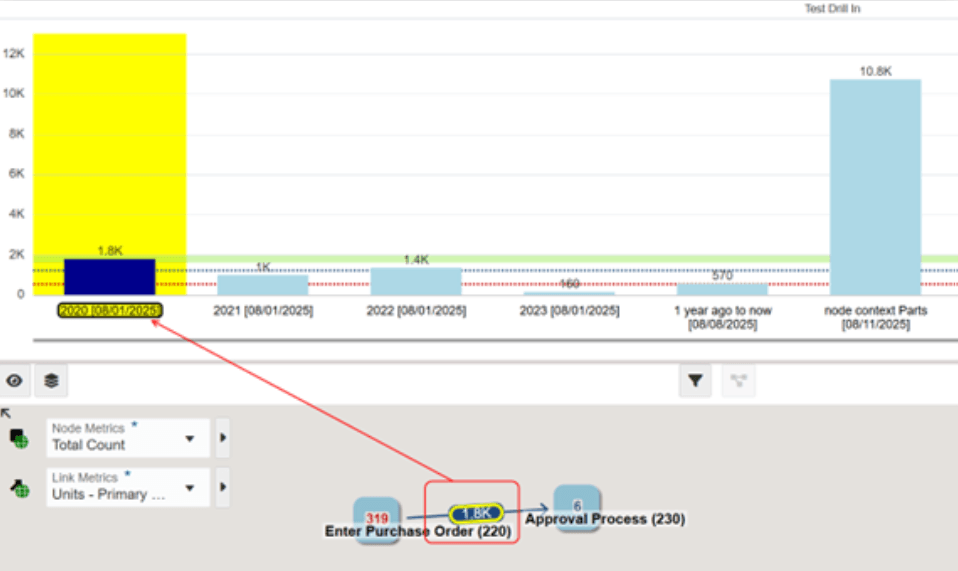
- If you change the threshold for the highlighted metric of the current node
or link, the system updates the chart on the snapshot analysis pane based on
the context of the currently analyzed node or link.
- The chart in the snapshot analysis pane updates to reflect the metrics
selected in the model pane.
- Click X to close the snapshot analysis pane.