Using Split View in Enterprise Process Modeler
To display adjacent panes of enterprise processes:
- Access the JD Edwards EnterpriseOne application.
-
From the User menu, click Enterprise Processes.
The Enterprise Process window is displayed along with the enterprise process diagram of the first process listed in the Select Process drop-down list.
-
Click the Create a new Split View icon
 .
.The system displays a new window along with the first enterprise process (from the Select Process drop-down list) on the right.
Note: You can remove a process by clicking the Remove this Split View icon . You can add any number of enterprise process panes side by side.
However, it is recommended not to add more than three panes for clarity and easy
navigation.
. You can add any number of enterprise process panes side by side.
However, it is recommended not to add more than three panes for clarity and easy
navigation. -
In the spilt view panes, select the processes you want to compare from the respective Select Process drop-down lists.
When you select the same enterprise processes to compare, the system displays the Toggle Compare View mode icon
 .Note: You can select specific processes, add them to the split view panes, and change the filter settings of the enterprise processes to analyze different processes.
 Change the filter settings and thresholds as per your requirements to compare the enterprise processes.
In the split panes, you can perform the filter changes and operations, such as changing the display and analytics options, changing the nodes and link metrics, saving, or selecting a snapshot, and so on .
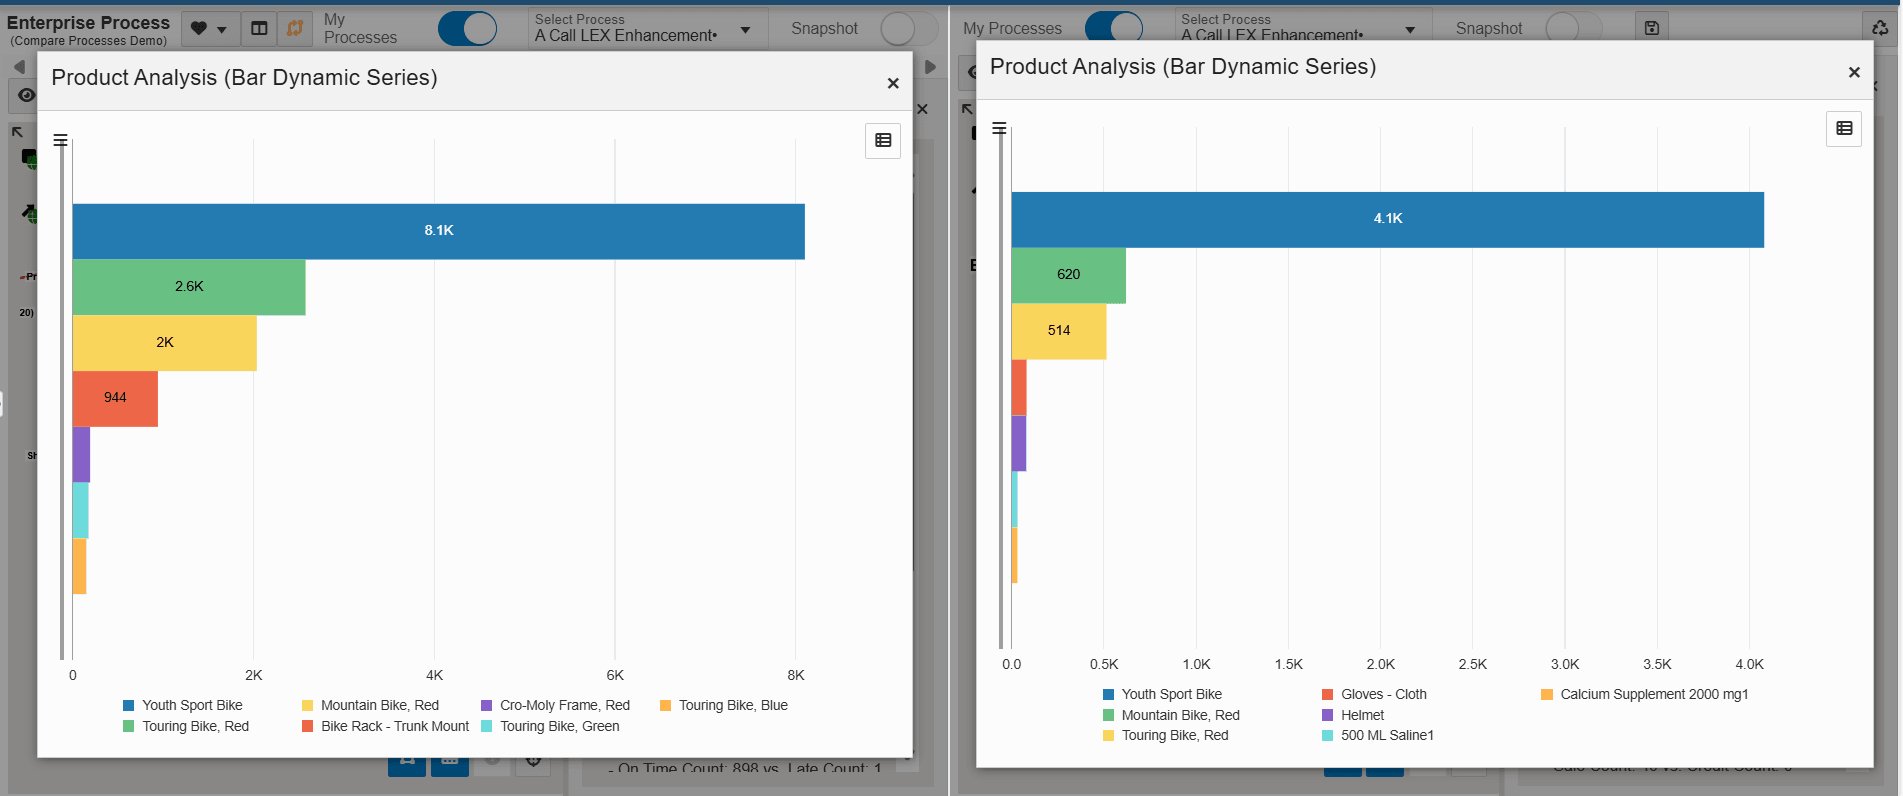
You can maximize the charts on the Process Analytics, Node Analytics, or Link Analytics tab, and analyze them.
See Analyzing an Enterprise Process.
For example, the following screenshot shows the maximized bar charts for Product Analysis.
-
To view the comparison summary between the two instances of the same processes, click the Toggle Compare View mode icon
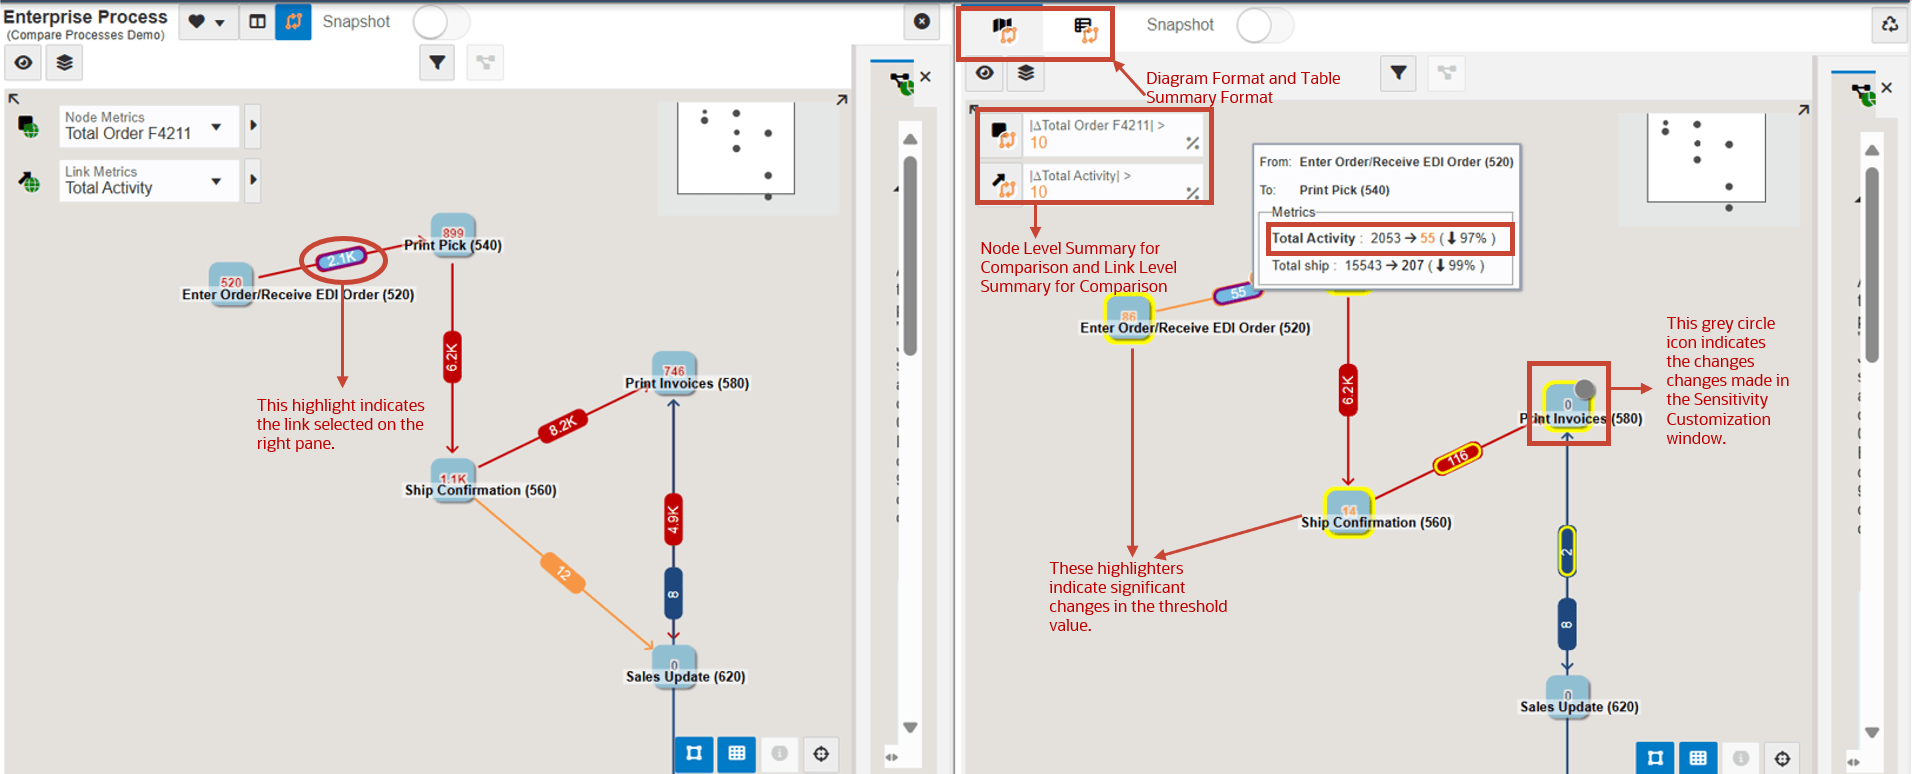
. The system displays the Node Level Summary for Comparison and Link Level Summary for Comparison fields along with the values selected in the Node Metrics and Link Metrics fields and a percentage threshold value as10by default on the process on the left. You can edit this percentage threshold value.Note: When you make changes to the values in the Node and Link Metrics columns on the left, the system updates the Node Level Summary for Comparison and Link Level Summary for Comparison fields on the right.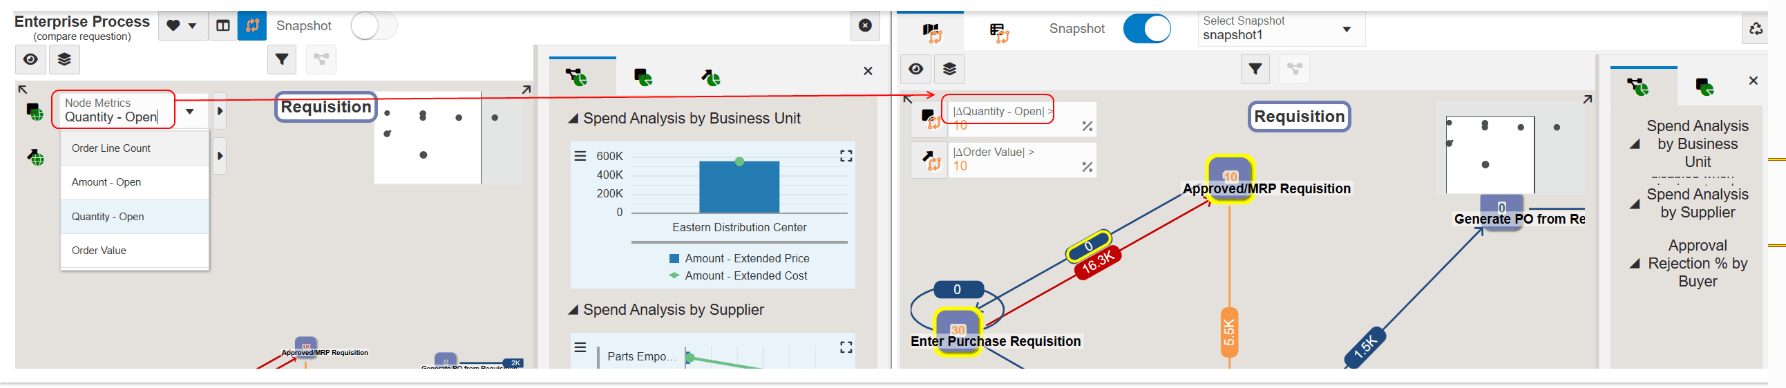
A highlight is displayed around the nodes and links in the enterprise process diagram when there is a significant difference beyond the specified percentage threshold for the link and node metrics.
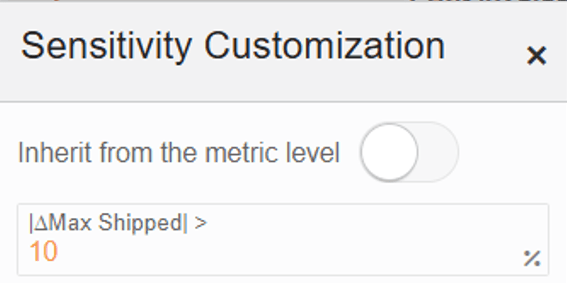
Hover over the nodes and links of the enterprise process diagram on the right pane, and click the indicator
icon. On the Sensitivity Customization window, the Inherit from the metric level option is enabled by default, and the nodes and links fetch the threshold values from the Node Level Summary for Comparison and Link Level Summary for Comparison fields.
Disable the Inherit from the metric level option to edit the percentage threshold value specific to the node or the link. Close the Sensitivity Customization window to save your changes.
When you make changes in the Sensitivity Customization window for a node or a link, the system displays a grey circle icon
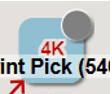 on them to indicate the changes. You can hover over the grey circle
icon and click to open the Sensitivity Customization window and modify or view
your changes.
on them to indicate the changes. You can hover over the grey circle
icon and click to open the Sensitivity Customization window and modify or view
your changes. For example, in the following screenshot, the hover text of the link displays a 55% decrease in Total Activity. The system also highlights the same link on the enterprise process on the left to indicate the compared link. The highlighters are displayed around the nodes and links of the compared process on the left to indicate a significant difference in the threshold value. On the Print Invoices node, a grey circle icon is displayed to indicate the changes made in the Sensitivity Customization window.
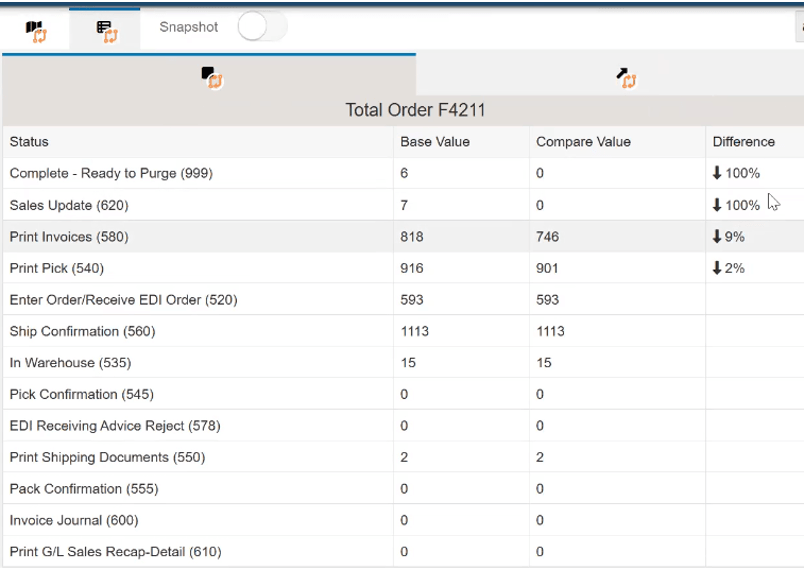
To view the summary of comparison in a table format, click the Table Summary Format icon
 . Click the Current Node Metric and Current Link Metric tabs to review
the comparative data.
. Click the Current Node Metric and Current Link Metric tabs to review
the comparative data.Current Node Metric Tab: Displays the list of statuses present in the enterprise processes diagram along with their Base Value, Compare Value, and Difference (by percentage).
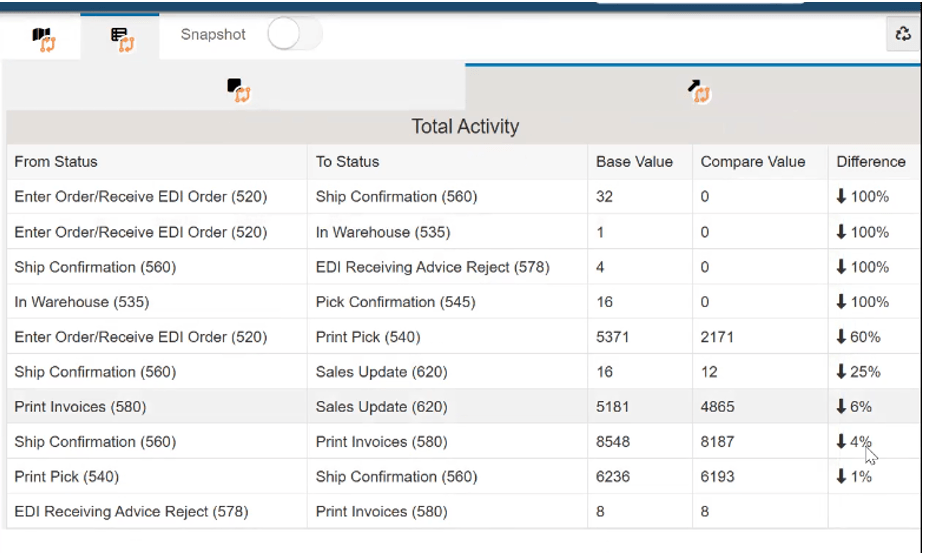
Current Link Metric Tab: Displays the From Status, To Status, Base Value, Compare Value, and Difference (by percentage) fields.
The settings for Show Zero Links and Show Zero Nodes on the Show Display Options window are considered in the table summary for the records. For example, if Show Zero Links is enabled, all the records, regardless of base or compare value, are displayed in the table summary. If Show Zero Links is disabled, all the records are displayed except those where both the base and compare values are zeros. See Using the Show Display Option.
- Click the Diagram Format icon
 to return to the enterprise process diagram.Note: Similarly, you can add and compare enterprise processes with connected processes using split view. For example, when you add the two instances of the same enterprise processes with connected processes to the split panes, the system presents the hierarchy window displaying the hierarchy between the parent and child process on the left pane. You can click a parent or child process on the hierarchy window to open them on both the split panes.
 -
Click the Preferences drop-down list, and click Save As Preference to save your preferences for the split view with a new name or click Save Preference to save your preferences with the previously saved name. The name of the preference is displayed in parentheses below the Enterprise Process text on the window.
You can click Load Preference to open a previously saved preference. You can also delete the preference by clicking Delete Preference, or open the first enterprise process by clicking Reset to Default.
Note: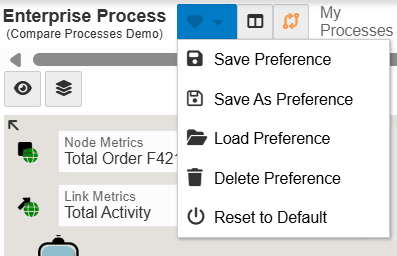
Similarly, you can compare two snapshots of the same enterprise process, or a snapshot of an enterprise process with the same process by enabling the Snapshot option and selecting the required snapshot from the Select Snapshot drop-down list from the split panes.
-
Click Close
 to close the Enterprise Process window.