Working with Supply Monitor for Sales Order Lines in Fulfillment Management
To work with supply monitor for sales order lines in Fulfillment Management:
-
Access the Enter New Order form.
Form Name
Form ID
Navigation
Enter New Order
W42101D
Sales Order Processing (G4211).
Select Create Sales Order - Detail First.
On the Manage Existing Order form, click the Add button.

-
On the Enter New Order form, enter order header and detail information.
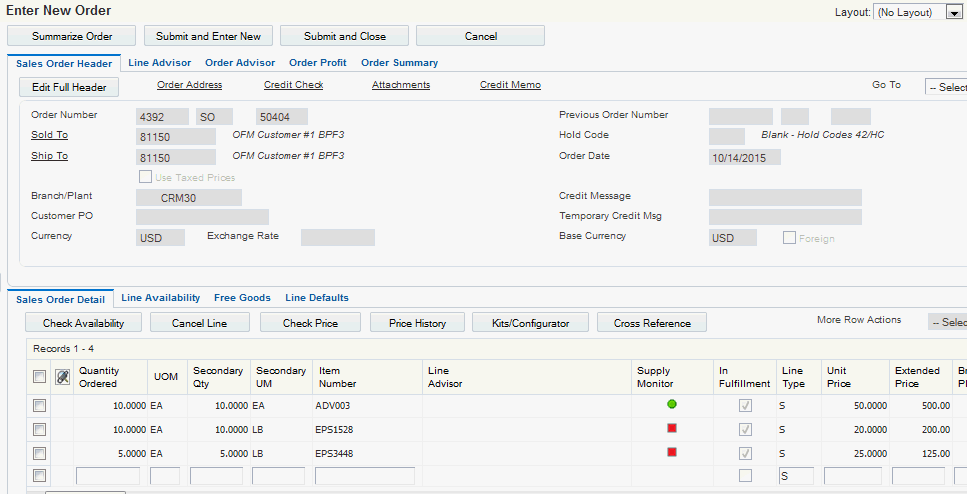
For order lines that enter into the fulfillment management process, the system displays a check mark in the In Fulfillment field. After the order lines are released from fulfillment, the system does not display icons in the Supply Monitor field.
When you tab off the order line, the system displays a green, yellow, or red icon in the Supply Monitor field to indicate the real-time potential to allocate inventory to the order.
-
The green icon (circle) indicates that the potential to allocate inventory to the order line is high.
-
The yellow icon (inverted triangle) indicates that the potential to allocate inventory to the order line is moderate.
In the Sales Advisor Constants program, you can specify the tolerance percentage used during the fulfillment potential process. The tolerance percentage determines how much of the available inventory the system considers possibly available.
-
The red icon (square) indicates that the potential to allocate inventory to the order line is low.
Caution: The functional design of the Supply Monitor application does not support the Fulfillment Management custom functions. If you are using a custom function for service level rules, the system may or may not render the icons and graphics. If the system does render icons and graphics, the information may or may not be accurate.The circumstances in which the system does not display an icon in the Supply Monitor field include:
-
The order line is in Fulfillment Management but is not eligible for processing through the Auto Fulfillment (R4277701) batch program. Examples include a kit parent or component, and order lines on hold.
-
Viewing the order line in change mode without modifying the line or selecting Evaluate Supply Monitor from the Row menu.
Note: If you enter an invalid version of the Auto Fulfillment Processing program (R4277701) in the Sales Advisor Constants program and the Fulfillment Management system is activated, the system does not process Supply Monitor and does not display the Supply Monitor icon. Also, the system does not display an error message. -
-
To display the Supply Monitor - Fulfillment Potential form, click the icon on a sales order line that you want to see supply monitor information.

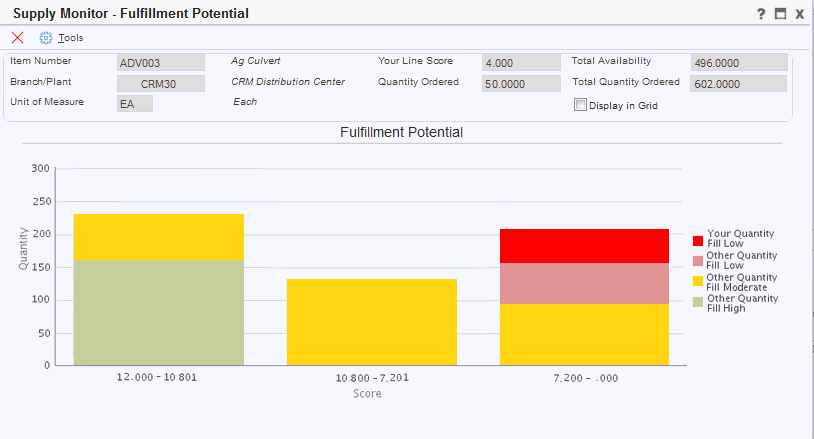
The chart displays the available quantity on the y-axis and score ranges on the x-axis. Additionally, the chart displays a maximum of 10 score ranges in a bar graph. Each bar in the graph represents the amount of quantity ordered that falls within the score range. The quantity represented by each bar combines to equal the total quantity for all order lines for the specified item. The colors on the bars represent the potential to fill your order quantity and the quantity for other orders lines. The ranges are based on scoring setup and the number of sales orders that the system is considering at the moment. If you do not set up the system to score order lines, the system displays icons and graphics based on a zero score.
The chart also displays a legend to describe the potential to fill your order line quantity in relation to the potential to fill other quantities for the same item. For example, in Figure 6-7, the bar with the score range 7.2 - 0 indicates the following information:
-
The total quantity ordered for order lines with item ADV003 in this scoring range is approximately 200.
-
The red shaded area of the bar represents your order quantity (50) and indicates that the potential to allocate inventory to your order line is low.
-
The light red shaded area of the bar represents the quantity (50) of a portion of the other order lines and indicates that the potential to allocate inventory to this portion of other order lines is low.
-
The yellow shaded area of the bar represents the quantity (100) of a portion of the other order lines and indicates that the potential to allocate inventory to this portion of other order lines is moderate.
As other transactions occur, such as an increase in inventory, canceled order lines, new order lines and so on, the potential to fill your order might change from low to moderate (yellow) or high (green).
Note: The lighter shades of red, yellow, and green represent quantities related to other order lines. Dark shades of red, yellow, and green represent quantities related to your order line.- Item Number
-
Displays the item number from the selected sales order line.
- Branch/Plant
-
Displays the branch/plant from the selected sales order line.
- Unit of Measure
-
Displays the unit of measure for the selected sales order line.
- Your Line Score
-
Displays the line score for your selected sales order line. The system calculates a line score based on how you set up the JD Edwards EnterpriseOne Fulfillment Management system to score order lines.
- Quantity Ordered
-
Displays the quantity ordered. This is the quantity ordered for the line item.
- Total Availability
-
Displays the amount of quantity available for the line item in the displayed branch/plant. The available quantity might consist of the on-hand quantity minus commitments, reservations, and backorders.
- Total Quantity Ordered
-
Displays the total quantity ordered for the item across all sales orders.
- Display in Grid
-
Select this option to have the system hide the graph and display the information in a grid format.
-
-
On the Supply Monitor - Fulfillment Potential form, click the Display in Grid option.
In grid format, the system displays 10 scoring ranges regardless of the number of bars in the bar graph. The ranges are based on scoring setup and the number of sales orders that the system is considering at the moment.
The system displays the total quantity of your sales order line across three columns - Your Quantity Fill High, Your Quantity Fill Moderate, and Your Quantity Fill Low. The system displays your quantities in the row that represents the scoring range for your line score.
- Begin Score
-
Displays the beginning score range (ascending or descending) to define data on a point in the fulfillment graph represented as a number.
- End Score
-
Displays the ending score range (ascending or descending) to define data on a point in the fulfillment graph represented as a number.
- Your Quantity Fill High
-
Based on your line score, the system displays the current quantity of your sales order line that has a high potential to be filled.
- Your Quantity Fill Moderate
-
Based on your line score, the system displays the current quantity of your sales order line that has a moderate potential to be filled.
- Your Quantity Fill Low
-
Based on your line score, the system displays the current quantity of your sales order line that has a low potential to be filled.
- Other Quantity Fill High
-
Based on the line scores of other sales order lines, the system displays the current total quantity of other sales order lines that have a high potential to be filled.
- Other Quantity Fill Moderate
-
Based on the line scores of other sales order lines, the system displays the current total quantity of other sales order lines that have a moderate potential to be filled.
- Other Quantity Fill Low
-
Based on the line scores of other sales order lines, the system displays the current total quantity of other sales order lines that have a low potential to be filled.
-
After reviewing the order information, click the Save and Submit button.
-
On the Manage Existing Order form, inquire on your sales order.
-
To display the Edit Sales Order form, select an order line and click the Select button.
When you initially access the Edit Sales Order form, the form does not display icons in the Supply Monitor field.
-
Select the order lines for which you want to evaluate supply monitor.
-
Select Evaluate Supply Monitor from the More Row Actions menu and click the Go button.
The system displays the icons in the Supply Monitor field.