Time to Complete
60 minutes.
Before You Begin
The journey toward Enterprise Automation has been unfolding over the past several releases of JD Edwards EnterpriseOne. Feature-by-feature, the roadmap continues to unfold, bringing you enhancements that help you analyze your data and discover potential process improvements. Release 25 introduced the most significant feature yet: the Enterprise Process Modeler. For Release 26, Enterprise Process Modeler offers several enhancements to further aid in analyzing your EnterpriseOne data, for example:
- Show the query criteria behind metrics and analytic charts
- Drill into the data shown on metrics and analytic charts
- Sort data shown in the analytic charts and filter for "Top 5"
- Split Views to help you compare process models and snapshots side-by-side
- Save and load configuration preferences
- Publish a process model to an EnterpriseOne page
In this Oracle by Example, you will explore these enhancements to help you achieve the Enterprise Automation cycle of Ingest > Model > Analyze > Solve > Measure to establish a practice of vigilance and continuous improvement in your processes.
What Do You Need?
To perform the steps in this tutorial, you will need:
- Access to a JD Edwards EnterpriseOne environment with Release 26 (Tools Release 9.2.26.0) or later. JD Edwards EnterpriseOne Trial Edition running on Oracle Cloud Infrastructure is suitable, but you can use any environment with the proper Tools release.
- Security permission to use Data Browser
- User-defined object security to create composed pages
- Optional: At least one enterprise process model created, such as the one in the Oracle by Example “Analyzing Business Processes Using Enterprise Process Modeler”. If you haven’t already created a process model, the first exercise will lead you through the steps to create one.
Task 1: Creating a Process Model from a Template
The exercises in this Oracle by Example rely on using a process model built with the Enterprise Process Modeler. If you already have a process model available, you can skip this exercise. If you don’t already have a process model, follow these steps to create one.
- Sign in to the EnterpriseOne web client.
- From the user menu (drop-down under your user ID), choose Manage Content > Processes.
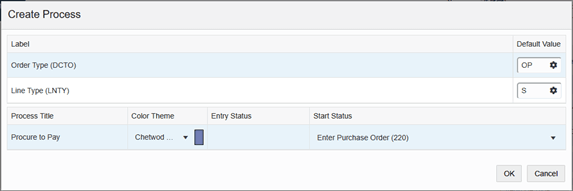
- If you are creating your first process model, the Create
Process pop-up window prompts you to choose from one of the
existing process model templates. From the drop-down list, choose
JDE TMPL Procure to Pay.
If you already have one or more process models, in the Name field, choose Create to create a new process model, and from the drop-down list of templates choose JDE TMPL Procure to Pay. - Click OK.
- On the Create Process pop-up window, click OK
to create a process model with the default values given.
Create Process pop-up window - Click the Preview (beaker) icon
 in the left-hand menu.
- Click the Show Filter Options (funnel) icon
 at the top of the process model.
- On the Override Filters pane, on the Order Date row, change the date in the field from 01/01/2024 to 01/01/2010.
- On the Order Company line, change the Operator
to “is not blank.”
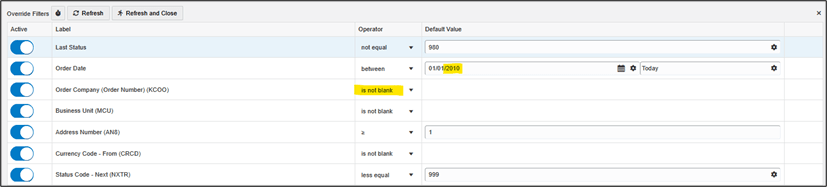
Show Filter Options Window - When the filters are configured as shown above, click the Refresh and Close button.
- Optional Step: At this point you can drag the nodes of the model to rearrange them.
- On the menu bar, click Save
 .
. - Enter a name for your process model, for example OBE Procure to Pay.
- Click OK.
- Click the Close icon
 .
.
You have now created a process model, which you can use for the remainder of the exercises.
Task 2: Showing Query Criteria and Detail Data for Metrics and Analytic Charts
The primary purpose of Enterprise Process Modeler is to help you analyze your EnterpriseOne data in the context of business processes. As you view the metrics and analytic charts with process models, you might have questions, such as:
- “I understand that this metric is the sum of all purchase orders at Status 220, but what Company, Business Unit, and time range does this represent?”
- “I understand that this data comes from the Fxxxx table, but what is the complete query criteria that generated this metric?”
- “This metric is much larger than I expected. What is the largest transaction contributing to this number?”
In this exercise, you will explore the “Show Query Details” and “Drill into Data” features to help you answer these questions.
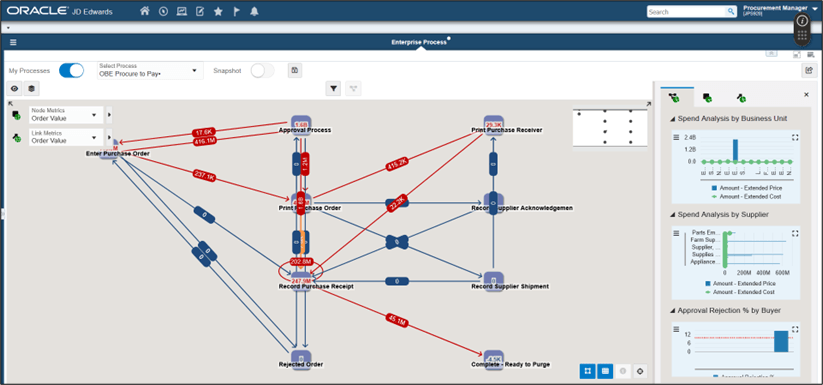
- From the EnterpriseOne web client home page, open the user menu and choose Enterprise Processes.
- In Enterprise Process Modeler, under the Select Process
drop-down, choose the process model you created in the previous
exercise, or any other process model you would like to explore.
The process model opens.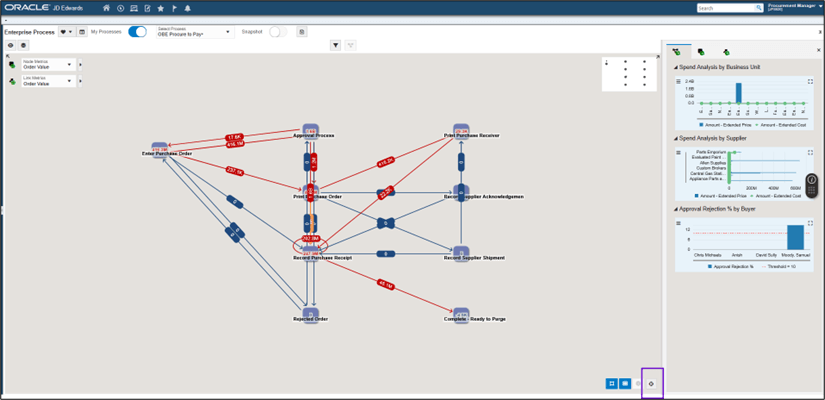
Select Process drop-down Note: At any time throughout these exercises you can use the Zoom to Fit icon
 to recenter your model within the frame.
You can also drag nodes to rearrange them.
to recenter your model within the frame.
You can also drag nodes to rearrange them.
- Suppose one of the metrics on the process model strikes your
curiosity. Right-click on that metric, for example, the Approval
Process node.
A context menu appears:
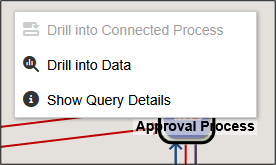
Context Menu - Choose Show Query Details.
The Query Details pane appears, showing complete details about how that metric was derived.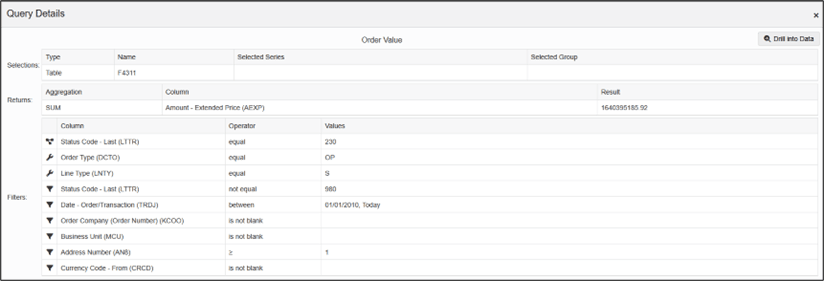
Query Details pane Now suppose that you would like to see the raw data from which this metric was derived.
- Click the Drill into Data button.
Note: You can also drill into the data from the context menu shown in step 3.
Enterprise Process Modeler launches Data Browser with the same query definition that was used to generate the metric. Now you can see the list of transactions from which the metric was derived. You can use all the native features of Data Browser, such as the query-by-example row and grid formats, to filter and sort the data.
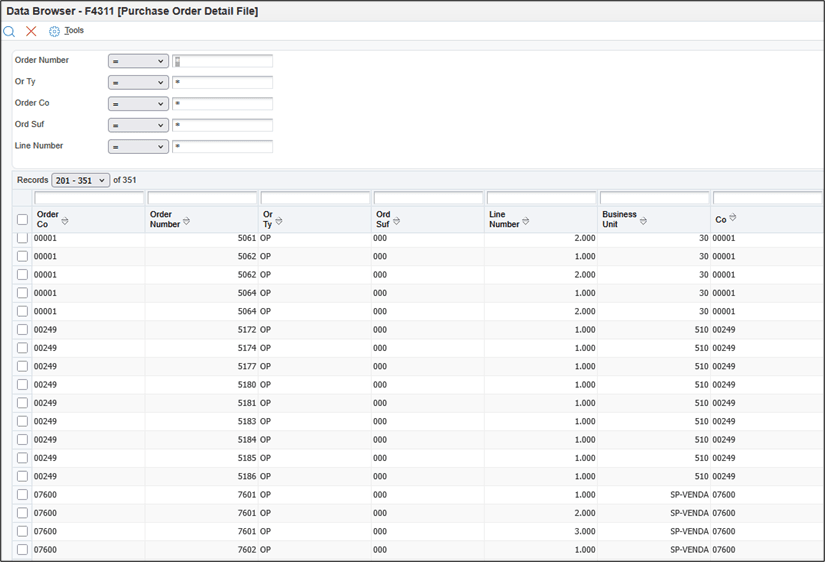
The Data Browser - Click Cancel
 to close Data Browser.
 - Click Close to close the Query Selector.
- Click Close
 to
close the Query Details pane.
to
close the Query Details pane.
Similarly, you can show Query Details and Drill into Data for the analytic charts.
- For any of the analytic charts, click the Configure
icon
 .
.
A menu appears with icons to Show Query Details
 and Drill into Data
 . You can click these icons to explore
the query criteria and source data for the analytic charts, just
as you did with node and link metrics.
. You can click these icons to explore
the query criteria and source data for the analytic charts, just
as you did with node and link metrics.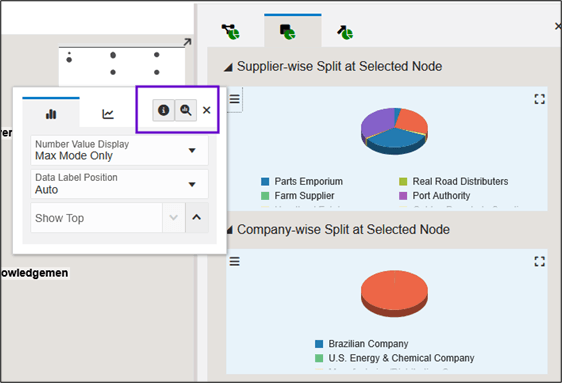
Menu showing the Show Query Details icon and Drill into Data icon Sometimes the query criteria for analytic charts reveal so much data that it is difficult to interpret it. In this case you can sort the data and also filter it to show only the top X number of data points.
- At the top of the process model, click the process model
icon
 to set the context to the process model (rather than node or
link).
to set the context to the process model (rather than node or
link). - On the Analytic pane, click the Process Analytics
icon
 to show the analytic charts for the process.
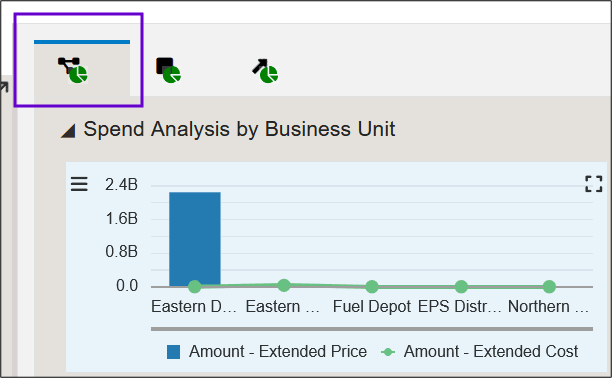
Analytic pane - Click the Maximize icon
 to maximize one of the analytic charts to
full-page view, such as the Spend Analysis by Supplier
analytic chart.
to maximize one of the analytic charts to
full-page view, such as the Spend Analysis by Supplier
analytic chart.
Notice that there could be so much data displayed that it is difficult to read:
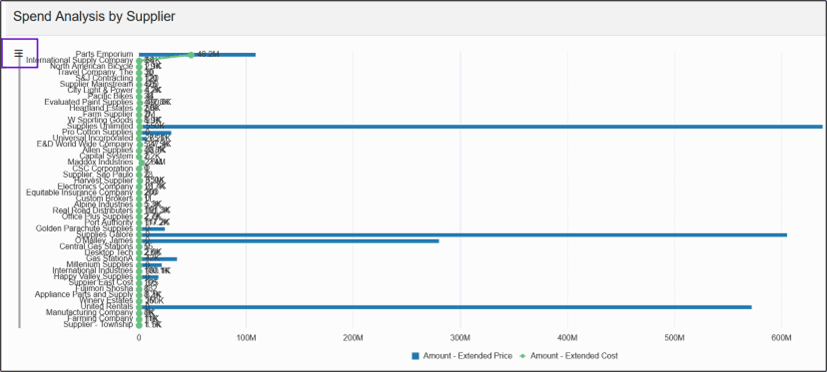
Spend Analysis by Supplier Analytic Chart - Click the Configure icon
 .
. - Click the Sort By drop-down and choose to sort
the data by one of the dimensions, for example, Amount –
Extended Price.
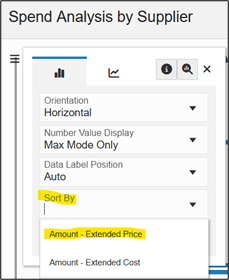
Sort By drop-down Notice that the data in the chart is now sorted by that dimension. Also, after you choose to sort, you see another option: Show Top. This option enables you to filter the data to show only the top X data points.
- In the Show Top field, enter 5 to show the top 5 data points.
- Click Close
 to close the Configuration box.
The analytic chart redraws with the data points ordered by Amount – Extended Price and only showing the top 5 values.
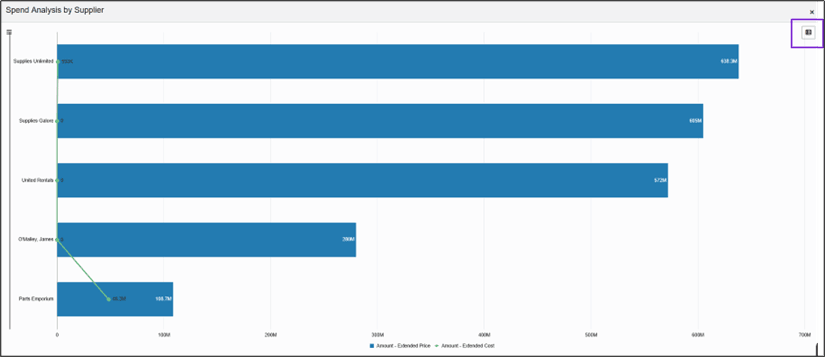
Analytic Chart Note: If you choose to show only the top X values for a pie chart, you will see one extra pie piece labeled “Other” to represent the sum of all other values.
- Right-click on any component in the chart. Notice that you can get contextual Show Query Details and Drill into Data for any individual component.
- Click the Toggle Table View icon
 at the top-right of the chart to
see the values in the charts in tabular format.
at the top-right of the chart to
see the values in the charts in tabular format. - Click the icons to get contextual Show Query Details and Drill into Data for any individual data point (row) in the table.
- Click the column headers to sort by Series, Group, or Value.
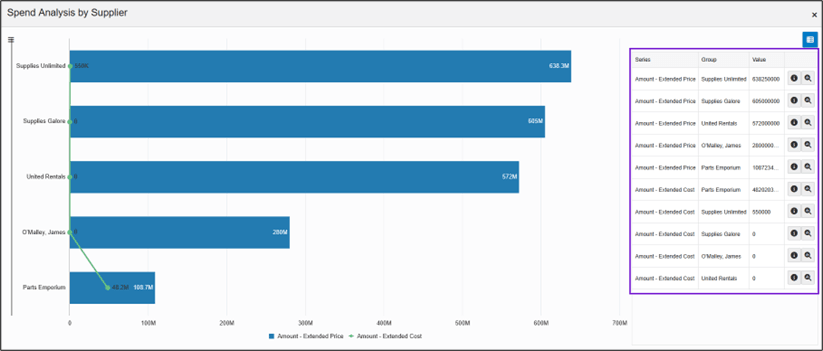
Sort By Menu for Spend Analysis by Supplier - Click Close
 to close the analytic chart.
Task 3: Comparing Process Models and Snapshots
The primary purpose of Enterprise Process Modeler is to help you improve your business through analysis of your EnterpriseOne business data, but you can’t tell if you are improving unless you have some way to make comparisons. Perhaps you want to compare performance over time, or perhaps you want to compare one company or one business unit against another. Enterprise Process Modeler enables you to capture “snapshots” of your EnterpriseOne data. In this exercise you will explore an enhancement in Release 26 that helps you compare process models and snapshots by creating “split views” and highlight the differences.
- Begin with your process model open in Enterprise Process Modeler.
- Click the Show Filter Options icon
 .
.
The Override Filters pane shows your current selection of filter criteria for the process model, metrics, and analytic charts.
- On the Order Date line, change the first date
field to 01/01/2020. Leave the second date field as Today.
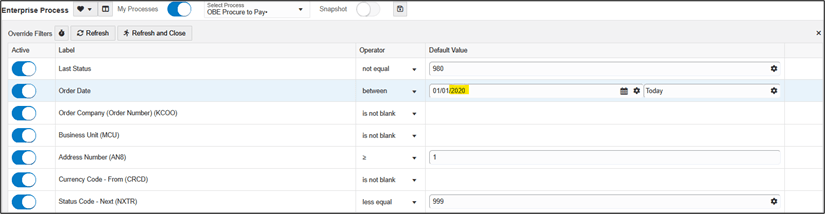
Filter Options Window - Click Refresh and Close.
The process model, metrics, and analytic charts refresh based on the new filter criteria. Next, you’ll save a snapshot of the process model based on these criteria.
- Click the Save as Snapshot icon
 at the top of the pane.
- In the Save as Snapshot pop-up, enter a short but meaningful name, for example, P2P since 2020.
- Click OK.
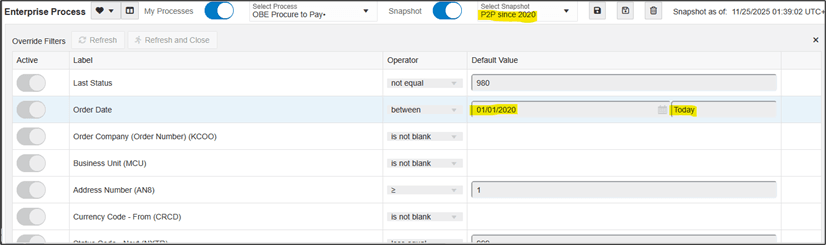
- Click the Show Filter Options icon
 at the top of the process model.
Notice that you cannot change the filter criteria for a snapshot, but verify that the Order Date filter is for the period 01/01/2020 to Today.
Filter Options Window - Click the Hide Filter Options icon
 to close the Override
Filters pane.
to close the Override
Filters pane. - With the Snapshot switch turned On, click the
Select Snapshot drop-down to see a list of your
saved snapshots. When you save other snapshots, they will be
listed here.
Notice that it is very easy to switch between the live process model and snapshots by toggling the Snapshot switch; however, it is very difficult to notice and compare any differences between them. In the next steps you’ll discover how to use split views to compare them more easily.
- Click the Snapshot switch to turn it Off.
- In the menu bar, click the Create a new Split View
icon
 .
.
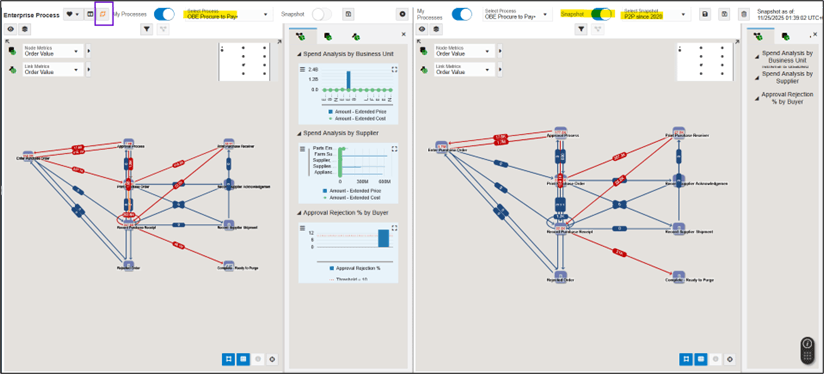
Enterprise Process Modeler creates a split screen; you now have two views from which you can view process models or snapshots.
Split Screen view of the Enterprise Process Modeler - In the second (right-hand) view, click to turn the Snapshot switch On.
- Choose the P2P since 2020 snapshot you saved earlier.
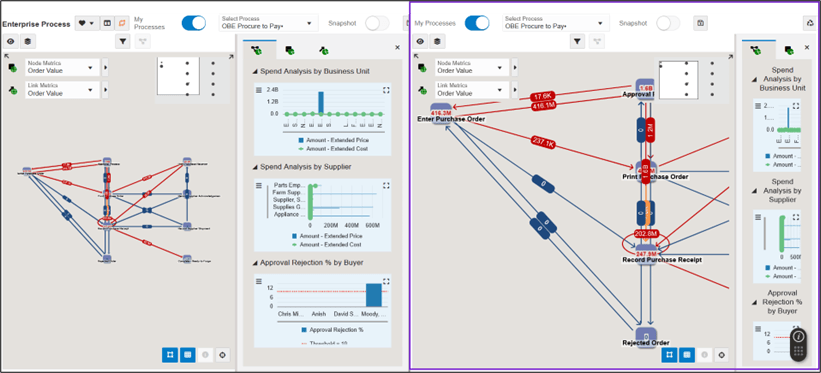
- At the top of the left view, click the Toggle Compare
View Mode icon
 .
.
The right-hand view now highlights any values that are different than the corresponding values in the main view. Because you might not want to highlight every small difference, the comparisons are based on a threshold that you can change in the input fields on the view; the default is 10%. You can also override this sensitivity threshold for any individual node or link.
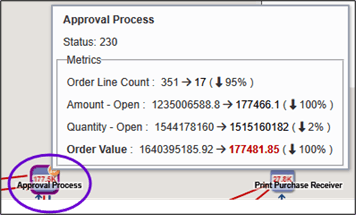
Split Screen view of the Enterprise Process Modeler - Hover over any node or link in the right-hand view to see a
hover pane with details about how the values compare to the
process model in the main view.
Hover text of the Approval Process node - In the right-hand view, click the Table Summary Format
icon
 to see a tabular list of all differences between the main view and
the right-hand view, ranked in order of the biggest difference.
Note that there are separate tabs for nodes and links.
to see a tabular list of all differences between the main view and
the right-hand view, ranked in order of the biggest difference.
Note that there are separate tabs for nodes and links.
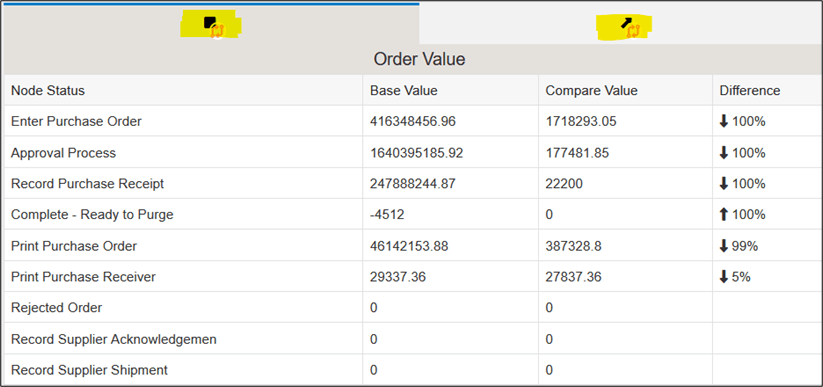
The Node Status summary view - Click the Diagram Format icon
 to return to the process model with
highlights.
to return to the process model with
highlights. - Click the Remove this Split View icon
 to
close a split view.
to
close a split view.
Note: If necessary, you can use the Zoom
to Fit icon  to fit and center the process model in the view.
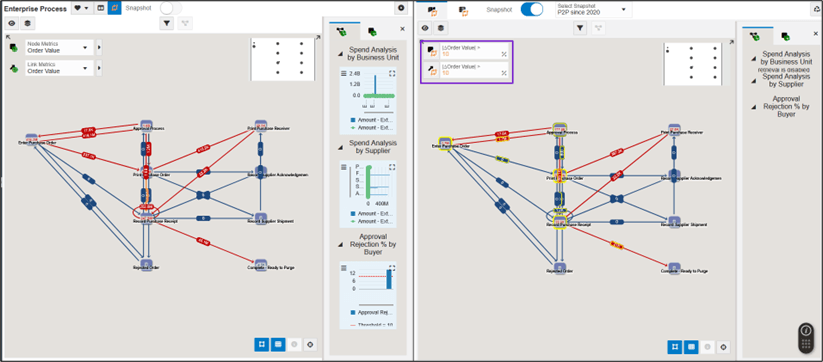
You now have a split view with the live process model in the main (left-hand) view and the P2P since 2020 snapshot in the right-hand view.
There are differences in the metrics between these two views; however, they are still very difficult to notice and compare.
In this exercise you learned how to create split views to easily view and compare differences between process models and snapshots. You can create as many split views as your computer monitor will practically show.
Task 4: Saving Preferences
Using Enterprise Process Model to analyze your EnterpriseOne business data is a very exploratory endeavor. You will likely find yourself changing filter configurations, saving snapshots, and setting up split views. While these tasks are not difficult, they can become tedious to reconfigure, especially when you find a few favorite configurations. In this exercise you will explore how to use Preferences to store and load sets of configuration and layout settings. In this scenario, imagine that you like the split pane view you created in the previous exercise, and you would like to return to it frequently and easily.
- Start in Enterprise Process Modeler with your process model loaded.
- Click the Preferences
 drop-down at the top left of the page and
choose Reset to Default.
drop-down at the top left of the page and
choose Reset to Default.
This reloads the process model from its original specifications and discards any filter or layout changes you have made.
- Click the Create a new Split View
 icon.
icon. - In the new split view, click the Snapshot switch to turn it On.
- From the Select Snapshot drop-down, choose your P2P since 2020 snapshot.
- Click the Preferences
 drop-down at the top left of the page and
choose Save As Preference.
drop-down at the top left of the page and
choose Save As Preference. - In the Save As Preference pop-up, give this set of preferences a short but informative name, for example, Compare with P2P since 2020.
- Click OK.
Now this view is saved as a preference, and you can reload it any time you want to return to it. - Click the Preferences
 drop-down at the top left of the page and
choose Reset to Default.
drop-down at the top left of the page and
choose Reset to Default. - Click the Preferences
 drop-down at the top left of the page and
choose Load Preference.
drop-down at the top left of the page and
choose Load Preference. - From the Select Preference pop-up, choose your
Compare with P2P since 2020 preference. When you
create other sets of preferences, they will be listed here.
Your split view with the P2P since 2020 snapshot loads. You can also make changes to filter criteria, node layout changes, and other configuration choices and save them as preferences.
- Click Close
 to close Enterprise Process Modeler.
Task 5: Adding a Process Model to an EnterpriseOne Page
While Enterprise Process Modeler provides a rich set of capabilities for “digging in” to visualize, analyze, and compare process models, it is also useful to have a process model available for viewing front-and-center as part of the EnterpriseOne user experience, and for that we turn to EnterpriseOne pages. By adding a process model to an EnterpriseOne page, you can view it immediately upon signing in to EnterpriseOne, and it takes its place among UX One pages, navigation pages, and other pages you may have built. You can put up to two process models on one EnterpriseOne page.
- Start at the EnterpriseOne home page.
- From the user menu (drop-down under your user ID), choose Manage
Content, and then click Composed Pages.
Verify that on the Welcome to the EnterpriseOne Page Composer! page, Create is displayed in the Name field.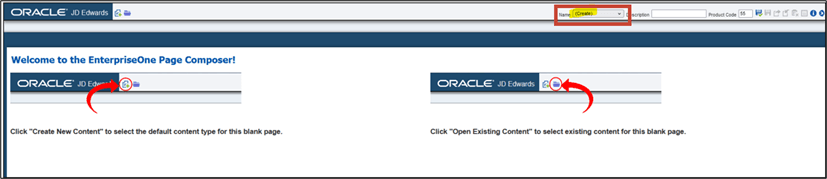
EnterpriseOne Page Composer - Click the Create New Content icon
 .
. - Click Enterprise Process Pane.
Note: If Enterprise Process Pane is not available in the list, it is because you have not yet created any enterprise process models.
- On the Create Link to Enterprise Process Pane window, in the Name field, enter Enterprise Process.
- Click OK.
The composed page canvas opens with an enterprise process pane covering the entire canvas because this is the only component on the page so far. At this point you could continue to add other content types to your EnterpriseOne page, or even add a second process model. For this exercise you will simply save the page as it is with a single enterprise process pane.
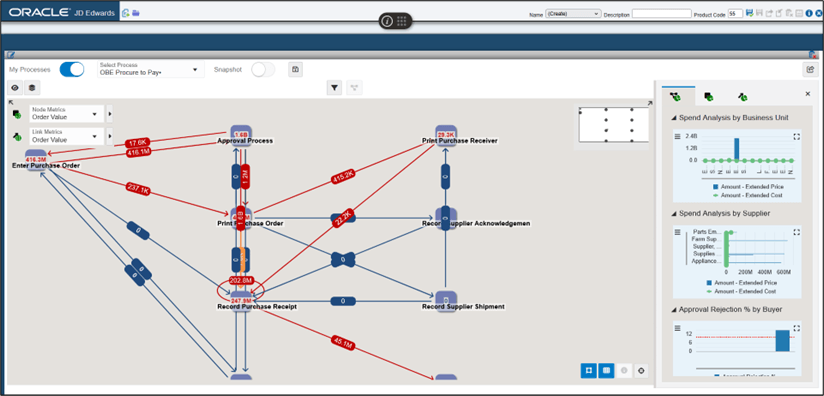
The Enterprise Process pane - In the menu bar, click the Save icon in the top right-hand corner.
- In the Enter New Name window, enter Enterprise Process and click OK to save the page.
- Click Close
 to close the design view for EnterpriseOne
pages.
to close the design view for EnterpriseOne
pages.
You now have an EnterpriseOne page from which you can view and interact with process models.
The Enterprise Process pane There are a few limitations when interacting with a process model on an EnterpriseOne page, for example, you cannot create split views, and you cannot save and load preferences by name; however, your changes will be saved for the next time you load the page. You can load other process models and snapshots, you can modify filter criteria, you can rearrange nodes, and you can change analytic chart configurations.
- Click the Open Enterprise Process icon
 at
the top right to launch from the process model in an EnterpriseOne
page directly to the same process model in Enterprise Process
Modeler.
at
the top right to launch from the process model in an EnterpriseOne
page directly to the same process model in Enterprise Process
Modeler.
Conclusion
In this Oracle by Example you have explored several Enterprise Process Modeler enhancements in EnterpriseOne Release 26 to further help you visualize and analyze your EnterpriseOne business data in the context of a process model:
- Show the query criteria behind the metrics and analytic charts
- Drill into the data shown on a metric or analytic charts
- Sort data shown in the analytic charts and filter for "Top 5"
- Split Views to help you compare process models and snapshots side-by-side
- Save and load configuration preferences
- Publish a process model to an EnterpriseOne page
With these new capabilities you can get an even clearer picture of your EnterpriseOne business processes on the path to continuous improvement.
Related Links
Enterprise Process Modeler Enhancements for Analyzing EnterpriseOne Data
G53195-01
April 2026
Copyright © 2026, Oracle and/or its affiliates.