Average Cost Analysis
This report gives you complete control over the information shown on the gauges, graphs, charts and tables. The purpose of this report is to provide some key metrics from the other reports in one cumulative view to analyze the average cost of items within the same company.
This report contains the following components:
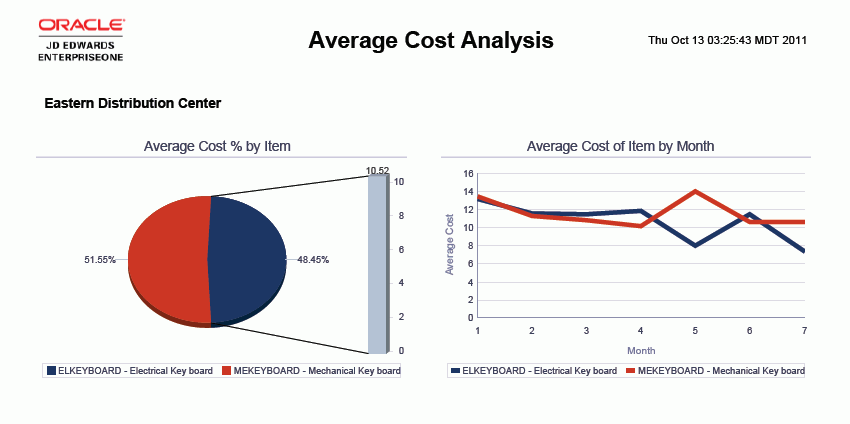
Average Cost Percentage by Item (pie chart)
Average Cost of Item by Month (line graph)
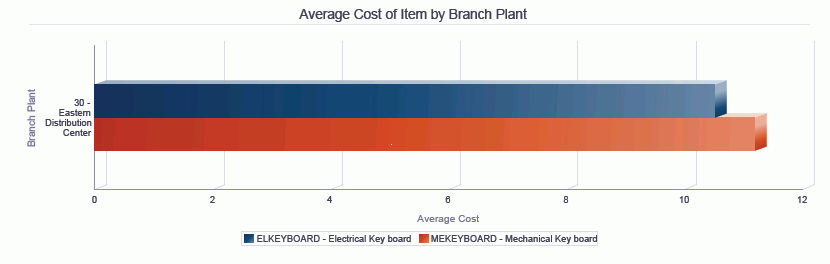
Average Cost of Item by Branch Plant (horizontal bar graph)
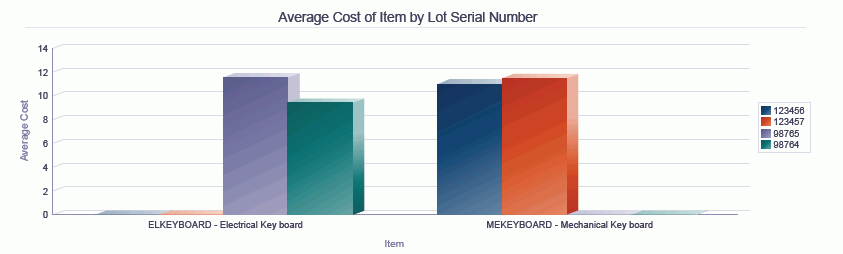
Average Cost of Item by Lot Serial Number (bar graph)
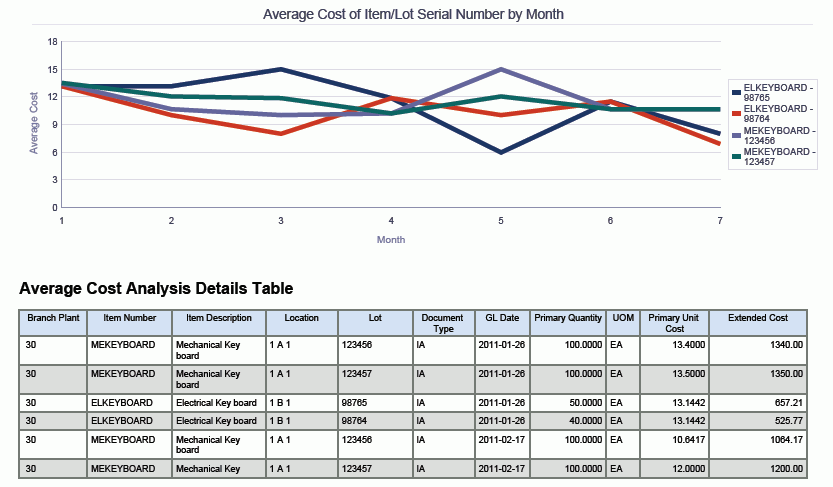
Average Cost of Item/Lot Serial Number by Month (line graph)
Average Cost Analysis Details (table)
When you run this report, you must have a document company specified in either the processing option or header of the One View Average Cost Analysis from Item Ledger Inquiry application.