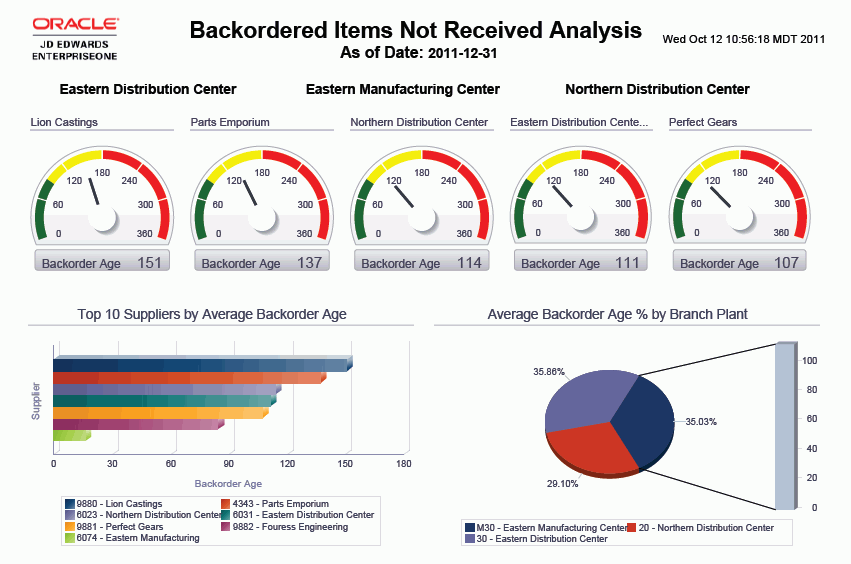
Backordered Items Not Received Analysis
The Backordered Items Received Analysis report provides you control over the information shown in the gauges, graphs, charts, and tables. For example, you can select a specific supplier from the gauges to show only information related to that supplier. This report provides some key metrics from the other reports in one cumulative view of backordered documents that need to be fulfilled or received. This report contains these report components:
Average Backorder Age by Supplier (gauges)
Top 10 Suppliers by Average Backorder Age (horizontal bar graph)
Average Backorder Age Percentage by Branch Plant (pie chart)
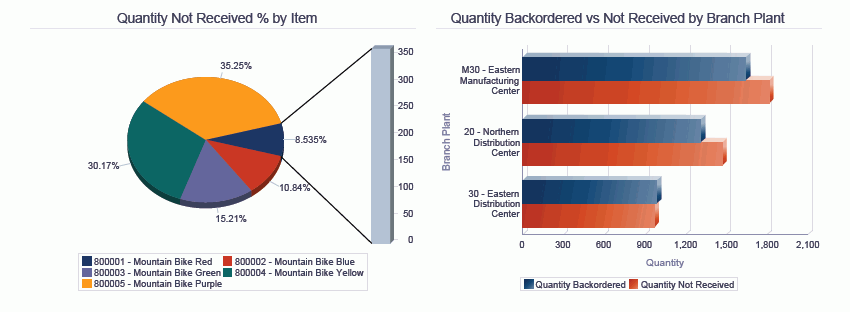
Quantity to be Received Percentage by Item (pie chart)
Quantity Backordered vs. to be Received by Branch Plant (horizontal bar graph)
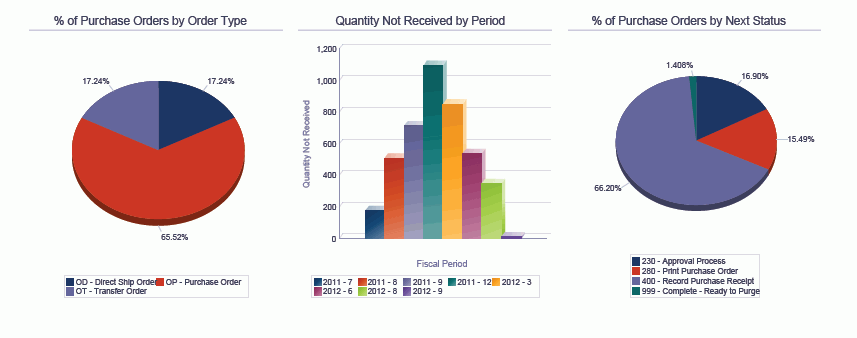
Purchase Orders by Order Type (pie chart)
Quantity to be Received by Period (bar graph)
Purchase Orders by Next Status (pie chart)
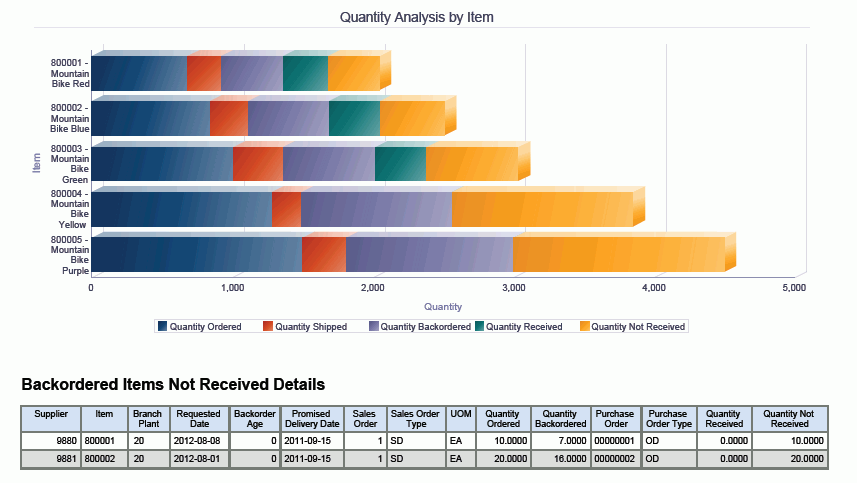
Quantity Analysis by Item (horizontal bar graph)
Backordered Items Received Details (table)
The Backordered Items Received Details Data table component contains drill back functionality as described in the following table:
Functionality |
Value |
|---|---|
Table column containing drill back link |
Sales Order Number |
Table columns passed to application |
Order Number, Order Type, Order Company |
Application called |
Sales Order Entry (P4210) |
Form called |
W4210E |
Version called |
ZJDE0000 |