DBA History Analysis
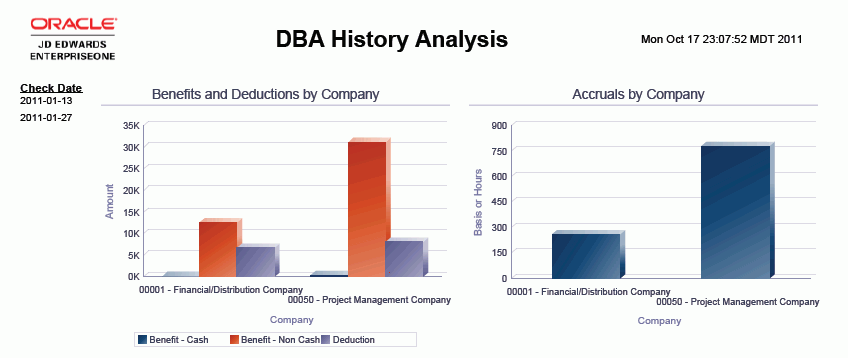
The DBA History Analysis report is a comprehensive DBA detail analysis report that includes elements such as DBAs by company, percentage by DBA, and Top Ten DBAs by business unit and amount.
This report contains the following components:
Benefits and Deductions by Company (bar graph)
Accruals by Company (bar graph)
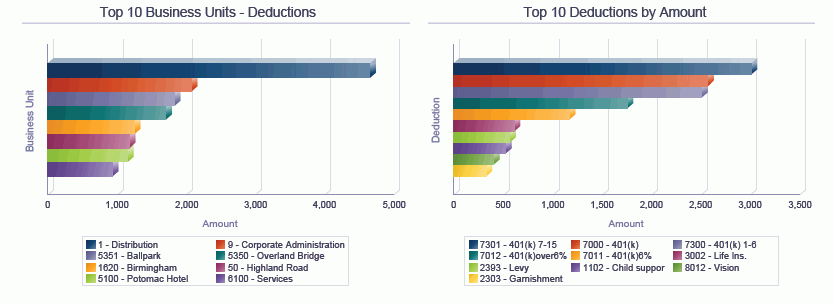
Top 10 Business Units - Deductions (horizontal bar graph)
Top 10 Deductions by Amount (horizontal bar graph)
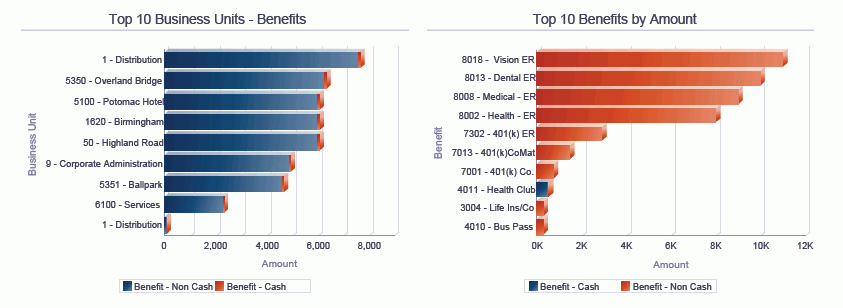
Top 10 Business Units - Benefits (horizontal bar graph)
Top 10 Benefits by Amount (horizontal bar graph)
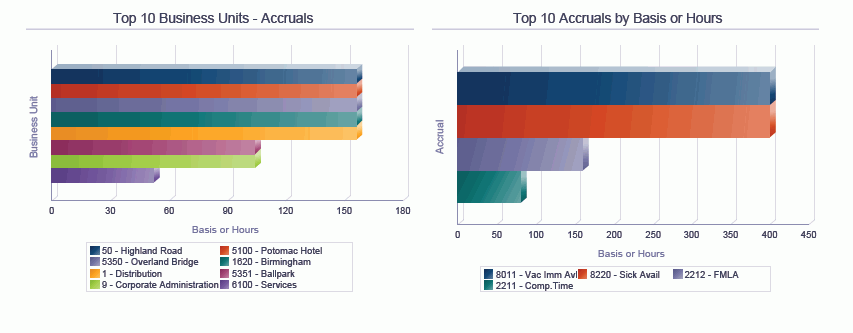
Top 10 Business Units - Accruals (horizontal bar graph)
Top 10 Accruals by Basis or Hours (horizontal bar graph)
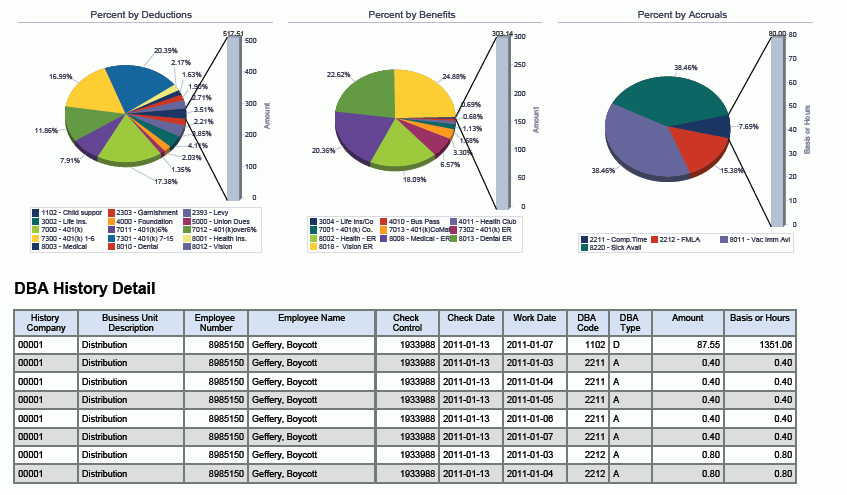
Percent by Deductions (pie chart)
Percent by Benefits (pie chart)
Percent by Accruals (pie chart)
DBA History Detail (table)
The DBA History Detail table component contains drill back functionality as described in the following table:
Functionality |
Value |
|---|---|
Table column containing drill back link |
Employee Number |
Table columns passed to application |
Employee Number, DBA Code |
Application called |
PDBAs History (P079951) |
Form called |
W079951D |
Version called |
ZJDE0001 |
The following report was generated by querying DBA history for all companies and DBAs for a particular time period, such as a month, quarter, or year.