Employee Benefits Analysis
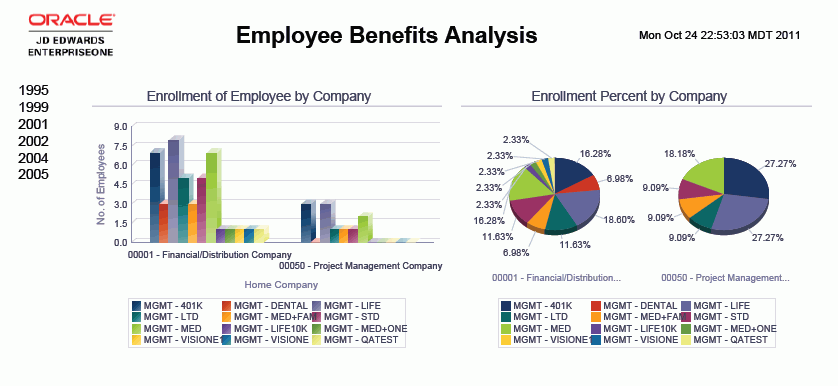
The Employee Benefits Analysis report is a comprehensive employee enrollment detail analysis report that includes elements such as enrollment of employee by company, percent of total cost, top 10 plans by employee enrollment, and trend of enrollment by month. The report contains these components:
Enrollment of Employee by Company (bar graph)
Enrollment Percentage by Company (pie chart)
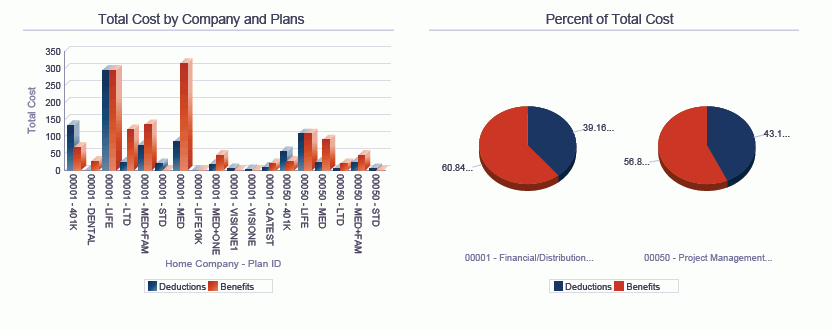
Total Cost by Company and Plans (bar graph)
Percentage of Total Cost (pie charts)
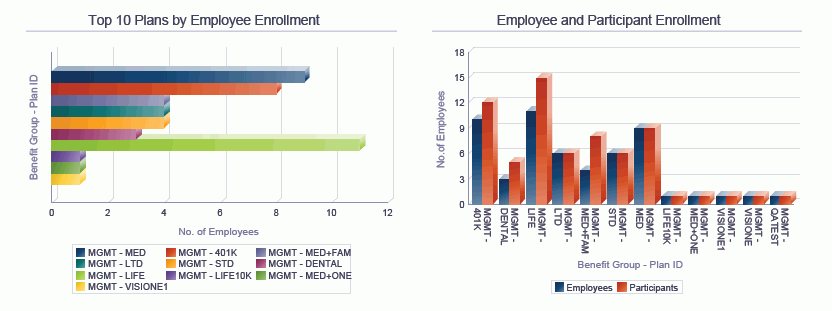
Top 10 Plans by Employee Enrollment (horizontal bar graph)
Employee and Participant Enrollment (bar graph)
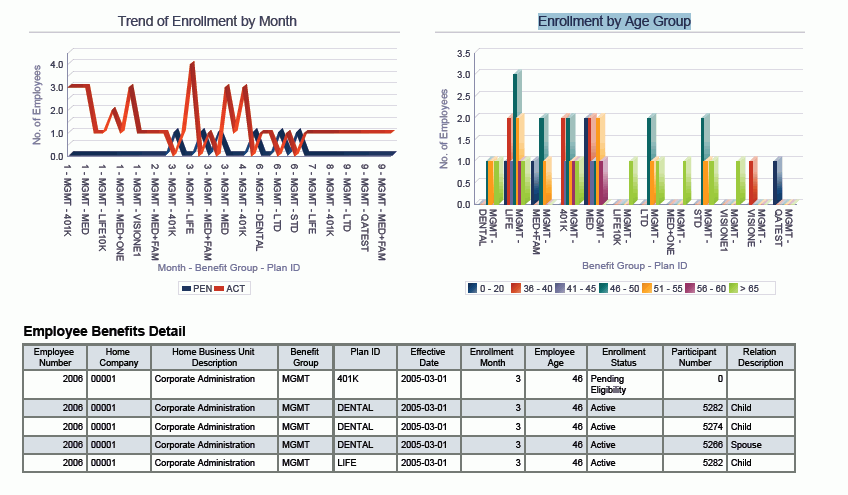
Trend of Enrollment by Month (line graph)
Enrollment by Age Group (bar graph)
Employee Benefits Detail (table)
The Employee Benefits Detail table component contains drill back functionality as described in the following table:
Functionality |
Value |
|---|---|
Table column containing drill back link |
Employee Number |
Table columns passed to application |
Employee No |
Application called |
Enrollment with Eligibility (P08334) |
Form called |
W08334A |
Version called |
None |