Environmental Incidents
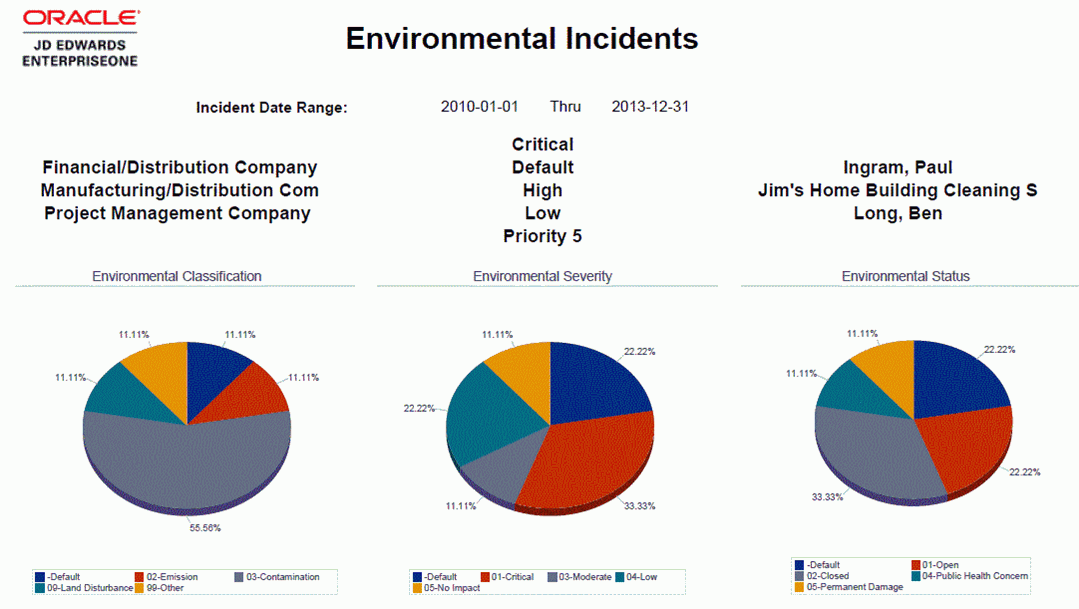
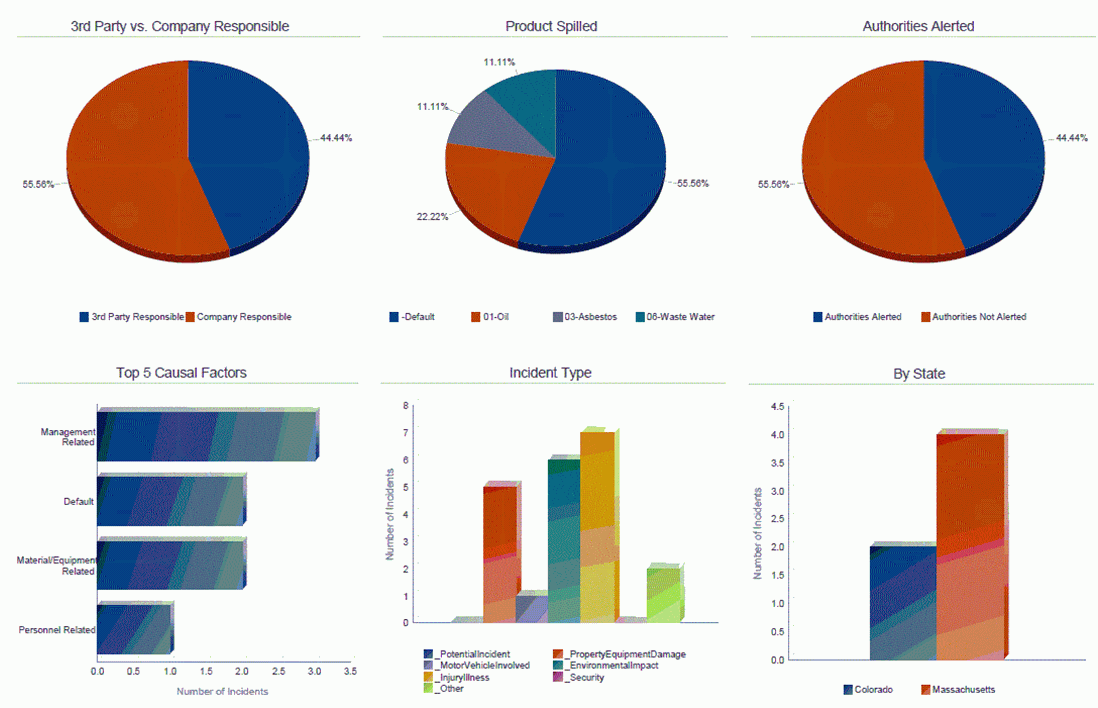
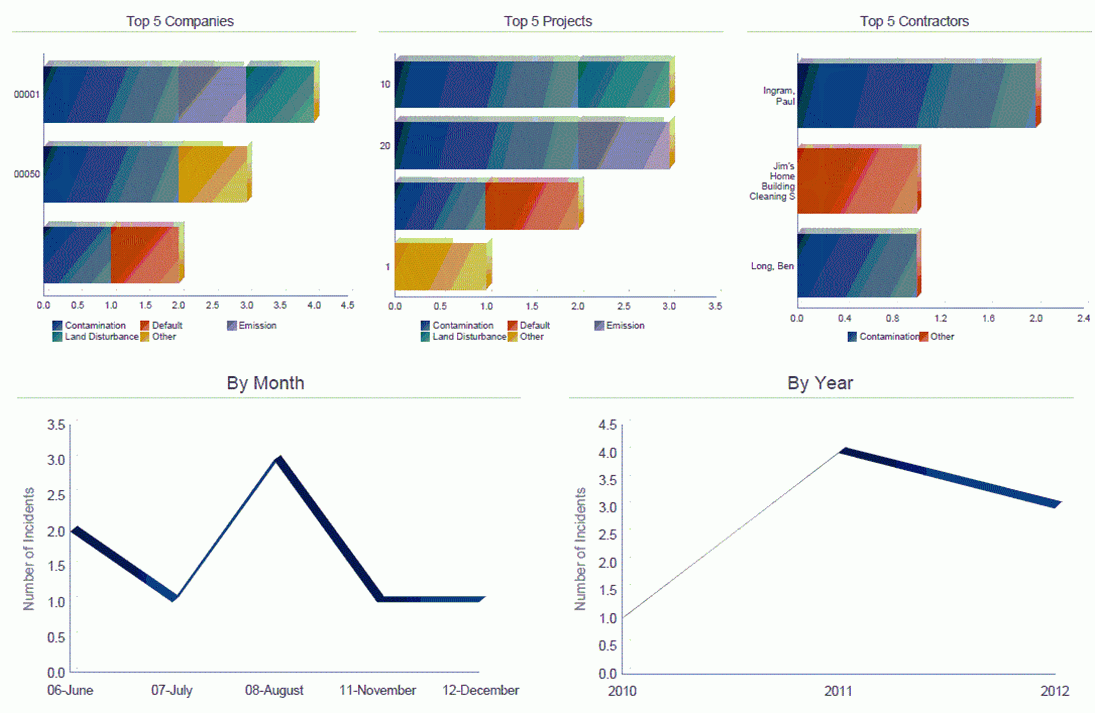
You use this report to analyze incidents that have an environmental or potential environmental impact. Only incidents that have environmental impact records are included. This report contains the following components:
Environmental Classification (pie chart)
Environmental Severity (pie chart)
Environmental Status (pie chart)
3rd party vs. Company Responsibility (pie chart)
Product Spilled (pie chart)
Authorities Alerted (pie chart)
Top 5 Causal Factors (horizontal bar graph)
Incident Type (vertical bar graph)
By State (vertical bar graph)
Top 5 Companies by Environmental Events (horizontal stacked bar graph)
Top 5 Projects by Environmental Events (horizontal stacked bar graph)
Top 5 Contractors by Environmental Events (horizontal stacked bar graph)
Environmental Incidents by Month (line graph)
Environmental Incidents by Year (line graph)
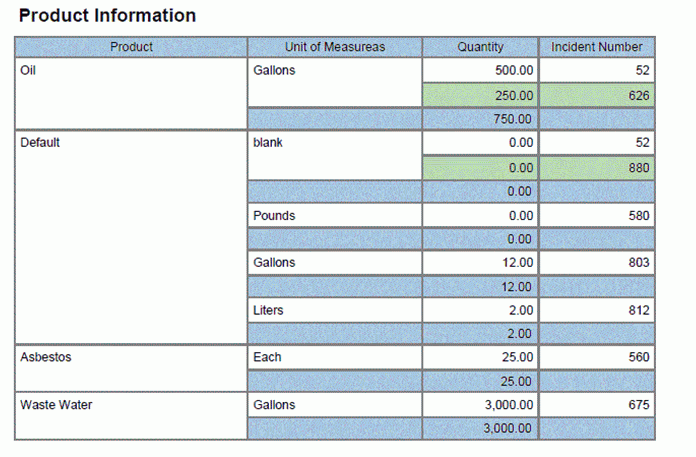
Product Information (table)
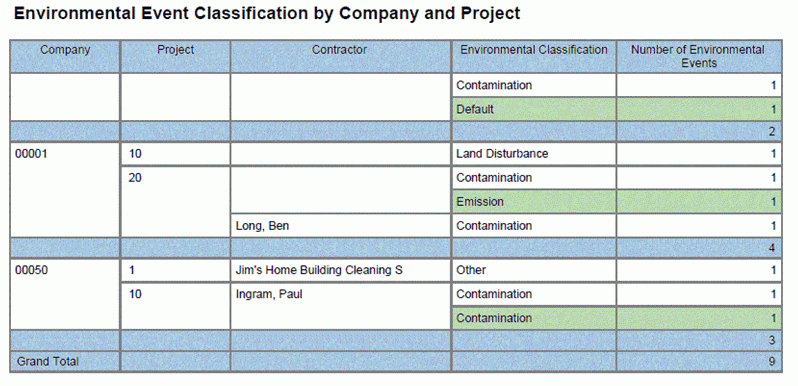
Environmental Event Classification by Company and Project (table)
Environmental Details (table)
Reference tables with Company, Project, Contractor, Environmental Classification, Environmental Status, and Environmental Severity descriptions
This report contains drill back functionality as described in the following table:
Functionality |
Value |
|---|---|
Table column containing drill back link |
Incident Number |
Table columns passed to application |
Incident Number |
Application called |
Incident Master (P54HS00) |
Form called |
W54HS00B |
Version called |
ZJDE0001 |
