Equipment Status Analysis
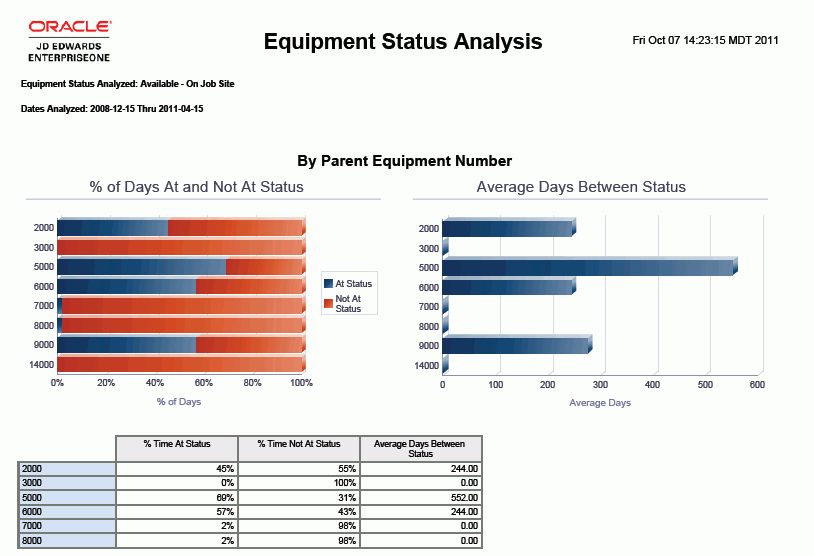
The Equipment Status Analysis report is a summary report that shows the status analysis for equipment by manufacturer, product family, product model and parent. For each, the report shows the Percentage of Days At and Not At Status, and the Average Days Between Status.
This report contains the following components:
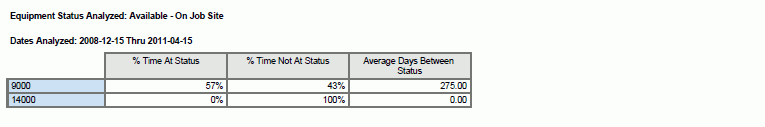
Percentage of Days At and Not At Status by Parent Equipment Number (horizontal bar graph)
Average Days Between Status by Parent Equipment Number (horizontal bar graph)
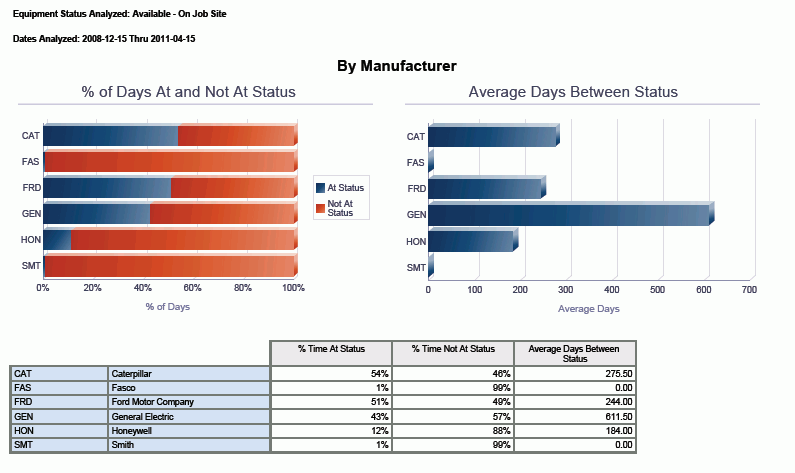
Percentage of Days At and Not At Status by Manufacturer (horizontal bar graph)
Average Days Between Status by Manufacturer (horizontal bar graph)
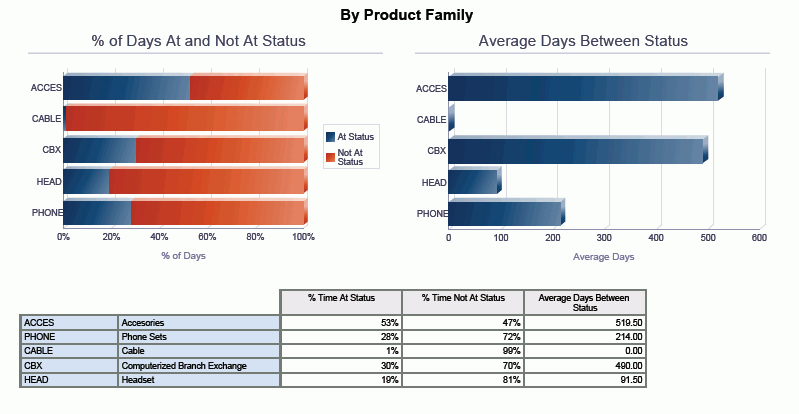
Percentage of Days At and Not At Status by Product Family (horizontal bar graph)
Average Days Between Status by Product Family (horizontal bar graph)
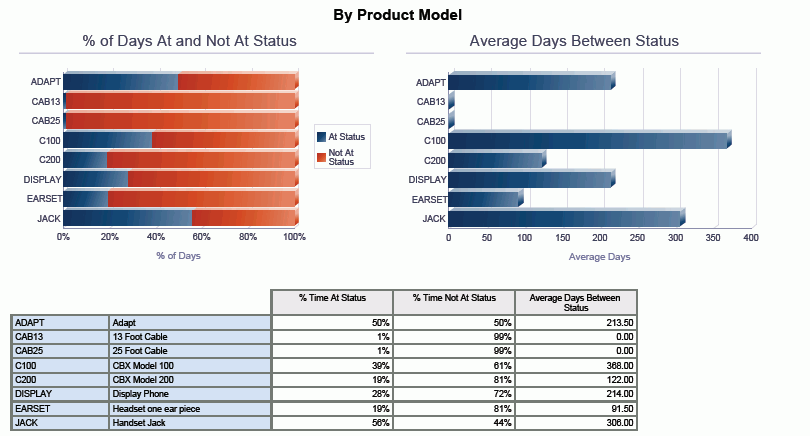
Percentage of Days At and Not At Status by Product Model (horizontal bar graph)
Average Days Between Status by Product Model (horizontal bar graph)
The following report was generated by selecting the date range as 12/15/2008 through 04/15/2011 and the equipment status to analyze as AV, Available - On Job Site.
To better understand the 16 calculations that are displayed in the grid columns, consider for a specific piece of equipment, the following status history. In the One View Equipment Status Inquiry application the status history records are aggregated into a single grid row and summarized with these 16 calculated columns, taking into account the status being analyzed and the time frame being analyzed as indicated in the header.
In the following example, 9/01/2011 through 10/07/2011 is being analyzed. The equipment has been at many different statuses during this time period. First, you need to understand how many days are being analyzed. This is simply 10/07/2011 less 9/01/2011, or 37 days.
(1) Total Number of Days = 37
Date Range Analyzed: 9/1/2011 through 10/7/2011
Status |
Status Begin Date |
Status End Date |
# Days at Status |
|---|---|---|---|
AV |
10/2/2011 |
OPEN |
6 |
DN |
9/30/2011 |
10/2/2011 |
2 |
AV |
9/26/2011 |
9/30/2011 |
4 |
DN |
9/24/2011 |
9/26/2011 |
2 |
AV |
9/18/2011 |
9/24/2011 |
6 |
SB |
9/16/2011 |
9/18/2011 |
2 |
DN |
9/13/2011 |
9/16/2011 |
3 |
AV |
9/5/2011 |
9/13/2011 |
8 |
SB |
9/3/2011 |
9/5/2011 |
2 |
1S |
9/1/2011 |
9/3/2011 |
2 |
If these status changes are shown on a time line, it looks like this, where each point in time is indicated as A, B, C … K, and the numbers shown represent the number of days the equipment was at that status:
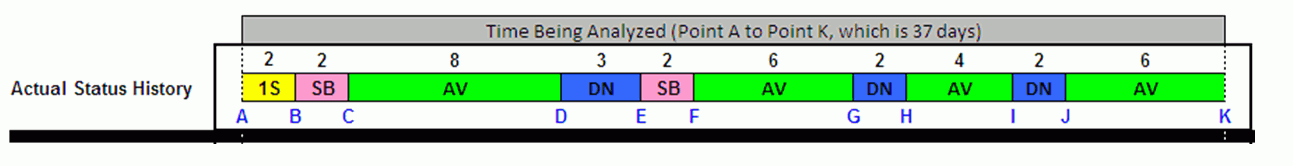
To analyze the AV - Available status, you first must divide the status/time segments into two pieces: At Status (AV) segments and Not At Status continuous segments. This is illustrated below, where the At Status segment is shown in green and the Not At Status continuous segments are shown in gray:
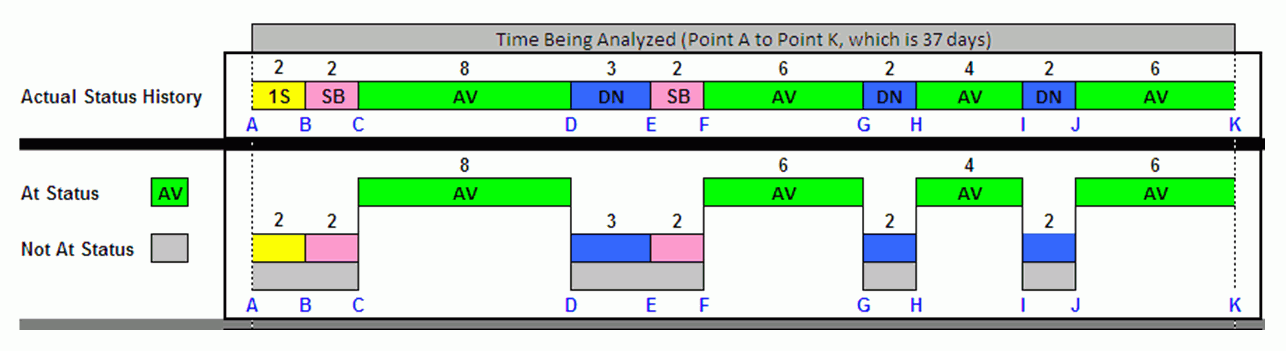
You can see that the equipment was at a status of AV four times during the analysis period for a total of 24 days (8 + 6 + 4 + 6).
(2) Number of Status Occurrences = 4
(3) Segments At Status = 4
(4) Segments Not At Status = 4
(5) Total Days At Status = (8+6+4+6) = 24
It was not at a status of AV also 4 times for a total of 13 days (2 + 2 + 3 + 2 + 2 + 2).
(6) Total Days Not At Status = (2+2+3+2+2+2) = 13
You can also easily calculate the average number of days the equipment was at and not at the AV status. This is the total number of days at (or not at) status divided by the number of segments. In this example:
(7) Average Days At Status = 24/4 = 6
(8) Average Days Not At Status = 13/4 = 3.3
Once you know the number of days at and not at status, it is easy to calculate the percentage at status and percentage not at status. Simply divide the days by the total number of days being analyzed, which is 37 in this example.
(9) % Days At Status = 24/37 or 65%
(10) % Days Not At Status = 13/37 or 35%
The previous diagram shows that there are three segments that are bracketed between an AV - available status. Those are segments DF, GH, and IJ. To calculate the Average Days Between Status, add up the days for those three segments and divide by three, the number of segments bracketed between an AV status.
(11) Bracketed Segments = 3
(12) Days Between Status = (3 + 2 + 2 + 2) = 9
(13) Average Days Between Status = 9/3 = 3
And finally, you need to calculate the Average Days To Status. This measures how many days it takes the equipment, on average, to reach a status (AV - Available in our example). In our example, it reached an AV status four times.
The first time during the analysis period, it took four days to reach AV (point A to point C, or 2 + 2 = 4 days).
The next time it reached a status of AV was point F, and it took 13 days to do so (point C to point F, 8 + 3 + 2 = 13 days).
The third time it took eight days (point F to point H, 6 + 2 = 8 days).
The last time it reached AV status in the analysis period it took six days (point H to point J, 4 + 2 = 6 days).
Adding these days up and dividing by the number of times AV status was reached gives you:
(14) Segments to Status = 4
(15) Total Days To Status = (4 + 13 + 8 + 6) = 31
(16) Average Days To Status = 31/4 = 7.8