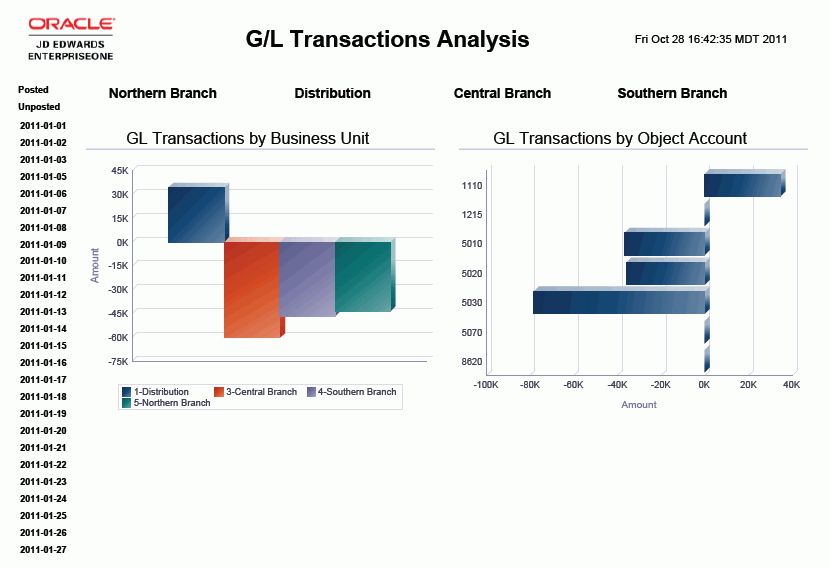
G/L Transactions Analysis
This report enables you to analyze a set of transactions in many ways. Use this report to analyze your Accounts Receivable, Accounts Payable, Revenue, or any number of account categories. It enables you to see the transactions in different ways to help you fully analyze the activity.
This report gives you complete control over the information shown in the graphs and table by providing filtering by G/L Date, Posted/Unposted Transactions, and Business Unit.
This report contains the following components:
GL Transactions by Business Unit (bar graph)
GL Transactions by Object Account (bar graph)
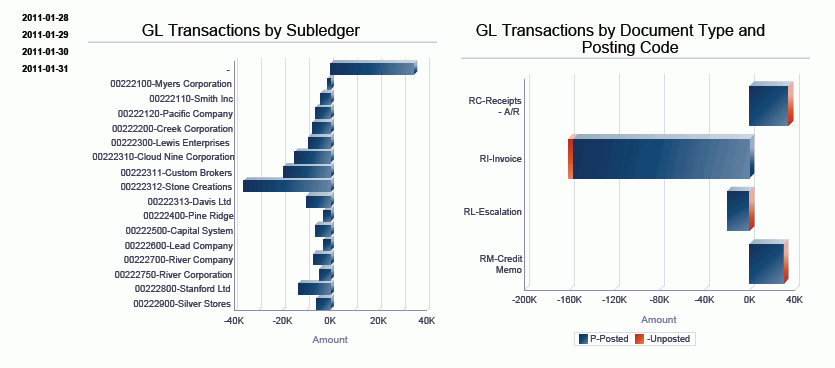
GL Transactions by Subledger (horizontal bar graph)
GL Transactions by Document Type and Posting Code (horizontal bar graph)
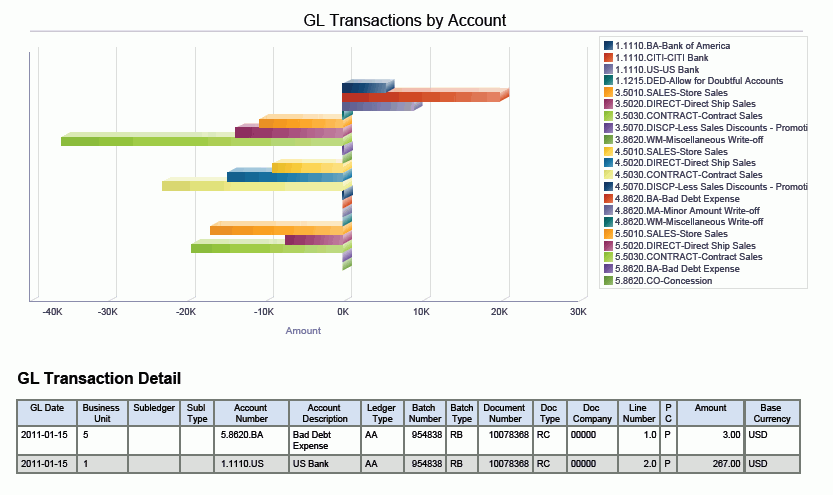
GL Transactions by Account (horizontal bar graph)
GL Transactions Detail (table upon which the previous charts are based)
The following report was generated by selecting the A/R Bank, Revenue, Write-off, Bad Debt, and Discount accounts for period 1 of fiscal year 2011 for company 00001 and business units 1, 3, 4, 5, and 9. It shows a broad view of all A/R activity for the period.