Historical Sales Analysis
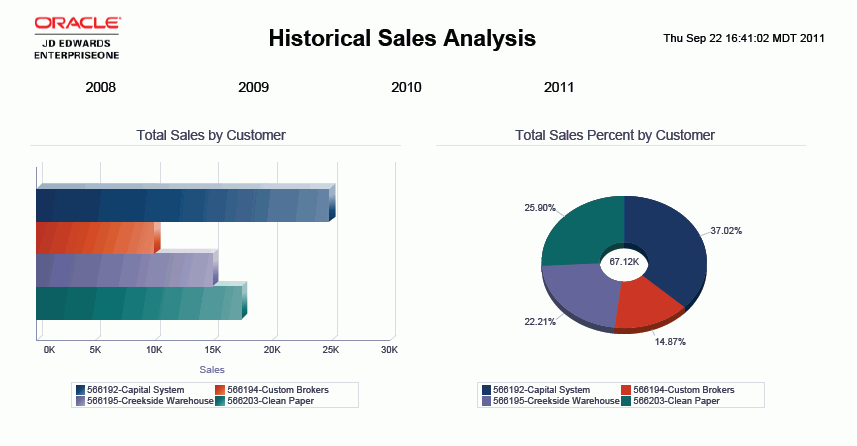
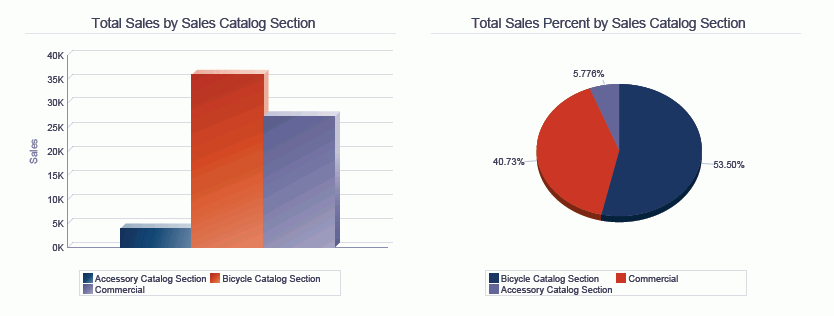
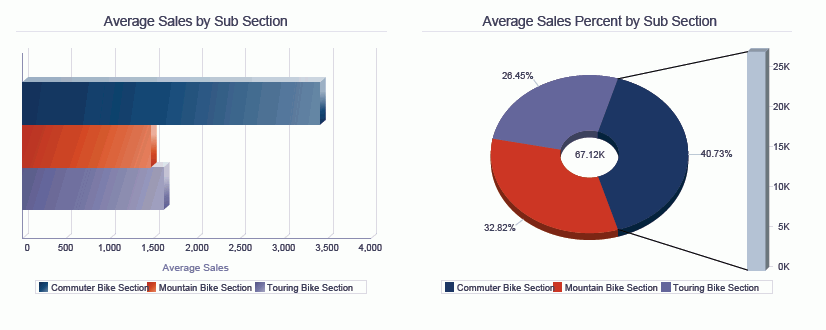
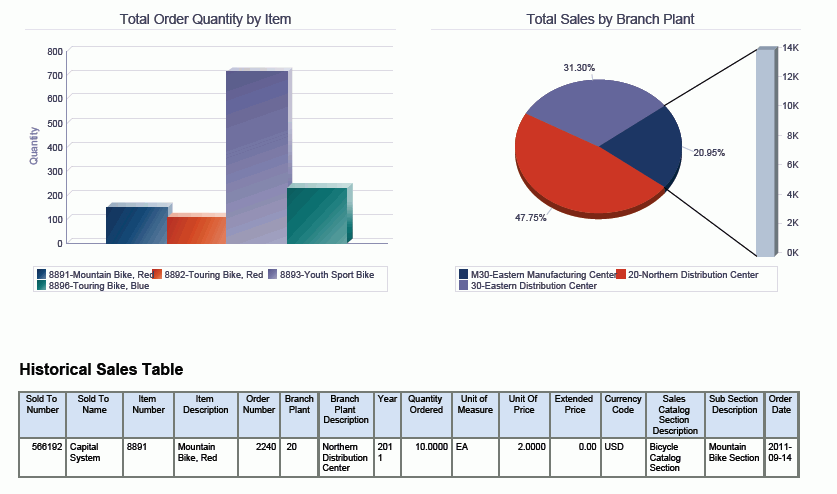
The Historical Sales Analysis enables you to view open sales orders using region information as a filter. The Total Sales by Customer bar chart enables you to compare the historic sales volumes for different customers within the selected region. The Total Sales Percent by Customer pie chart enables you to view the percentage of sales by customers in the selected region. The Total Sales by Sales Catalog Section bar chart enables you to view the total historical sales for items within each sales catalog section category code.You could use another category code associated with the item record. The Total Sales Percent by Sales Catalog Section pie chart enables you to view the percentage of historical sales by the sales catalog section category. You could use another category code associated with the item record. The Average Sales by Sub Section bar chart enables you to view the average historical sales for items within each sub section category code. You could use another category code associated with the item record. The Average Sales Percent by Sub Section pie chart enables you to view the percentage of historical sales by the sub section category code or you could use another category code associated with the item record. The Total Order Quantity by Item bar chart enables you to view the total historical quantity of items that have been sold for the selected region. The Total Sales by Branch Plant pie chart enables you to view the percentage of historical sales by branch plants in the selected region. The Historical Sales Orders Table displays the sales order detail lines that were included in the selected region.
This report contains the following components:
Total Sales by Customer (horizontal bar graph)
Total Sales Percentage by Customer (donut graph)
Total Sales by Sales Catalog Section (bar graph)
Total Sales Percentage by Sales Catalog Section (pie chart)
Average Sales by Sub Section (horizontal bar graph)
Average Sales Percentage by Sub Section (donut graph)
Total Order Quantity by Item (bar graph)
Total Sales by Branch Plant (pie chart)
Historical Sales Table
The Historical Sales table component contains drill back functionality as described in the following table:
Functionality |
Value |
|---|---|
Table column containing drill back link |
Order Number |
Table columns passed to application |
Sold To Number, Item Number, Order Number |
Application called |
Sales Order Entry (P42101) |
Form called |
W42101C |
Version called |
ZJDE0001 |