Inventory Valuation Analysis
This report gives you complete control over the information shown on the gauges, graphs, charts, and tables. The purpose of this report is to provide some key metrics from the other reports in one cumulative view to understand the inventory value levels within the same company.
This report contains the following components:
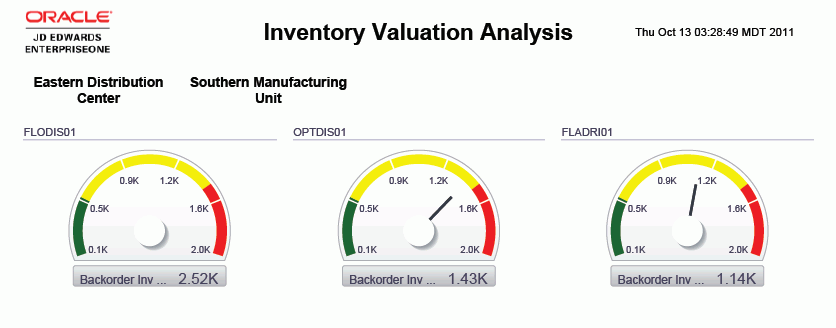
Backordered Inventory of Items by Branch/Plant (gauges)
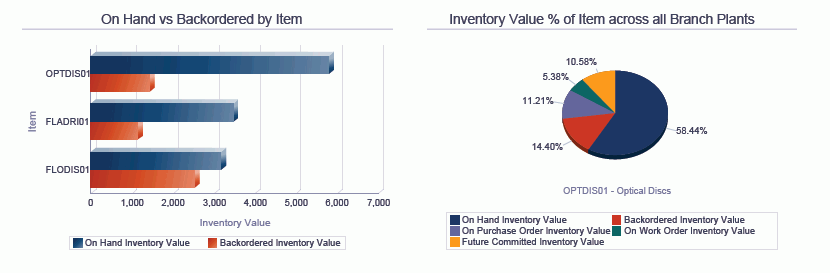
On Hand vs. Backordered by Item (horizontal bar graph)
Inventory Value Percentage of Item across All Branch Plants (pie chart)
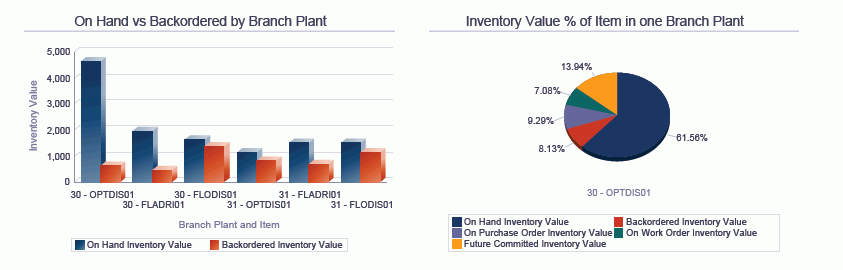
On Hand vs. Backordered by Branch Plant (bar graph)
Inventory Value Percentage of Item in One Branch Plant (pie chart)
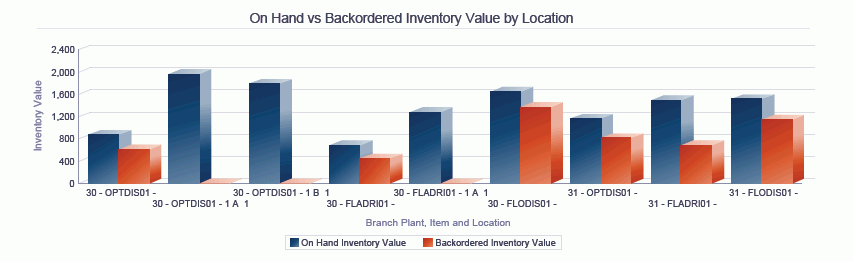
On Hand vs. Backordered Inventory Value by Location (bar graph)
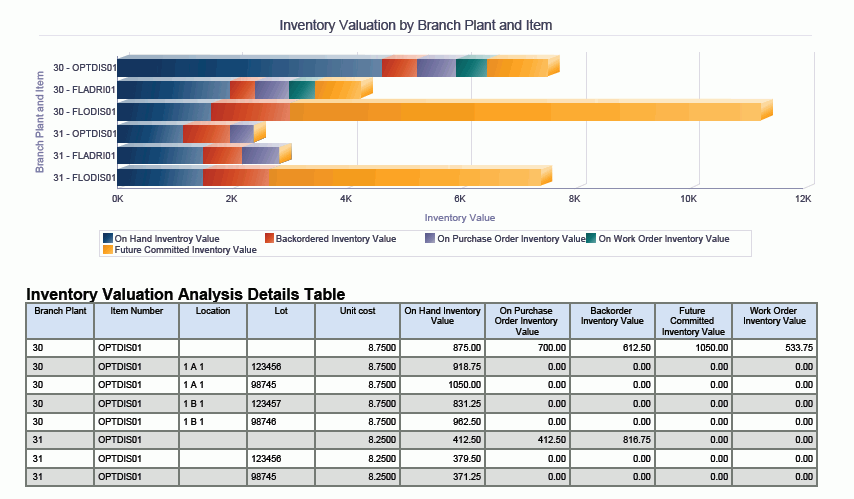
Inventory Valuation by Branch Plant and Item (horizontal bar graph)
Inventory Valuation Analysis Details (table)
The Inventory Valuation Analysis Details table component contains drill back functionality as described in the following table:
Functionality |
Value |
|---|---|
Table column containing drill back link |
Item Number |
Table columns passed to application |
Item, Branch Plant, Location |
Application called |
Item Ledger Inquiry (P4111) |
Form called |
W4111A |
Version called |
ZJDE0001 |