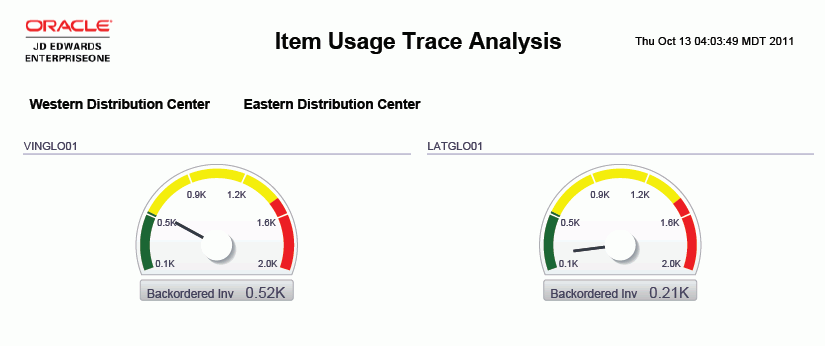
Item Usage Trace Analysis
This report gives you complete control over the information shown on the gauges, graphs, charts, and tables. The purpose of this report is to provide some key metrics from the other reports in one cumulative view to help analyze inventory movement over a span of time. On Hand and Backordered Inventory is based on Item, Branch/Plant, Location and Lot combination.
This report contains the following components:
Backordered Inventory (gauges)
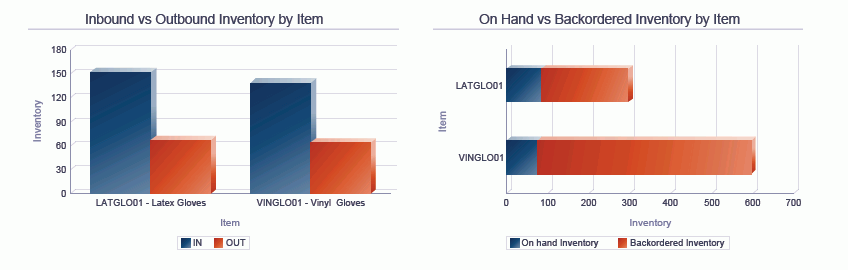
Inbound vs. Outbound Inventory by Item (bar graph)
On Hand vs. Backordered by Item (horizontal bar graph)
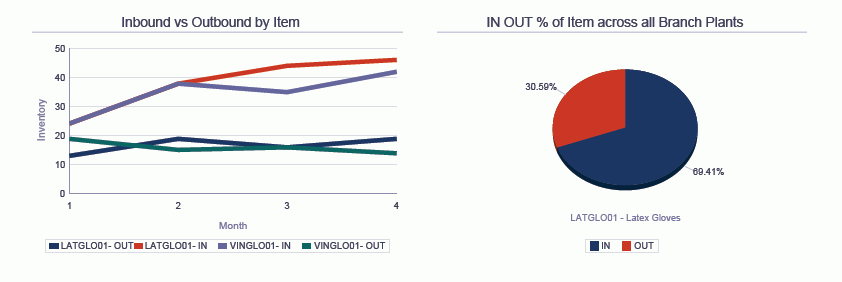
Inbound vs. Outbound by Item (line graph)
IN OUT Percentage of Item across all Branch Plants (pie chart)
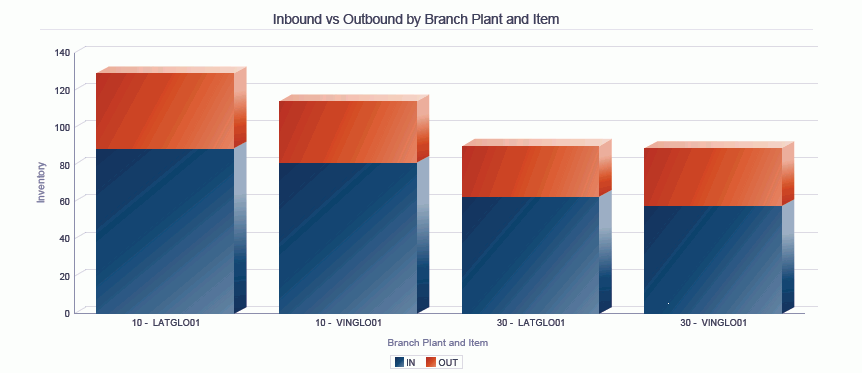
Inbound vs. Outbound by Branch Plant and Item (bar graph)
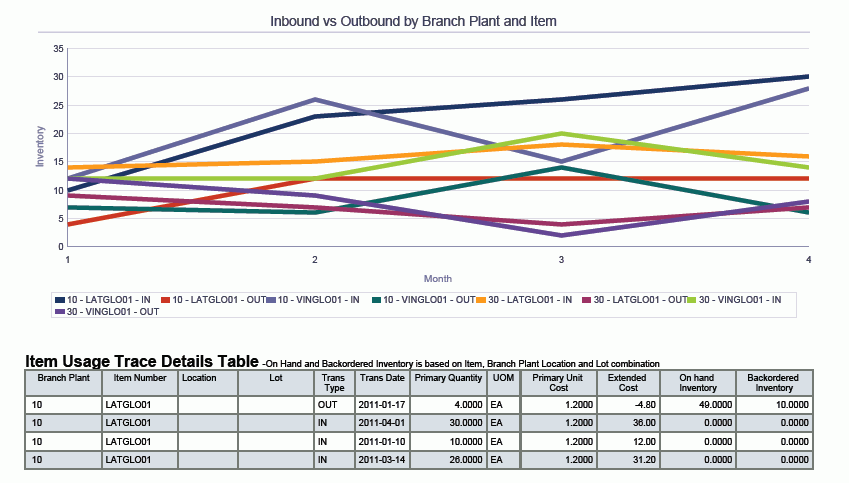
Inbound vs. Outbound by Branch Plant and Item (line graph)
Item Usage Trace Details (table)
The Item Usage Trace Details table component contains drill back functionality as described in the following table:
Functionality |
Value |
|---|---|
Table column containing drill back link |
Item Number |
Table columns passed to application |
Item, Branch Plant |
Application called |
Item Ledger Inquiry (P4111) |
Form called |
W4111A |
Version called |
ZJDE0001 |