Occupancy Analysis
The Occupancy Analysis report is a report of all units, both occupied and vacant by square footage. The first component of the report is a list by Region - Property Category Code 2. When you select a region from the list, all the charts and data are refreshed to display only the information related to that code.
This report contains the following components:
Region - Property Category Code 2 (list)
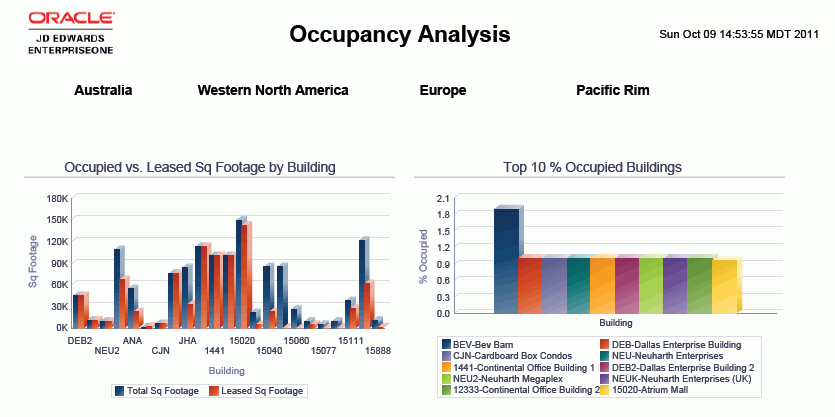
Occupied vs. Leased Square Footage by Building (bar graph)
Top 10% Occupied Buildings (bar graph)
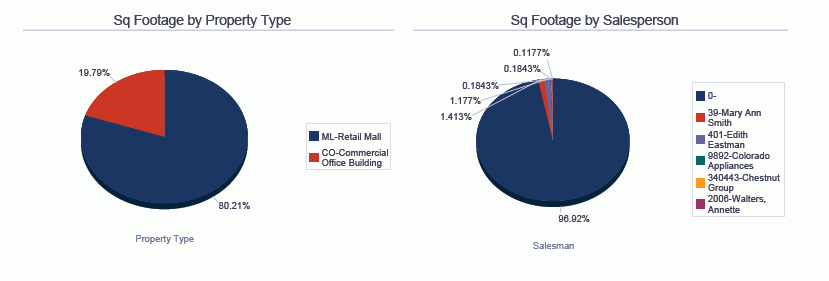
Square Footage by Property Type (pie chart)
Square Footage by Salesperson (pie chart)
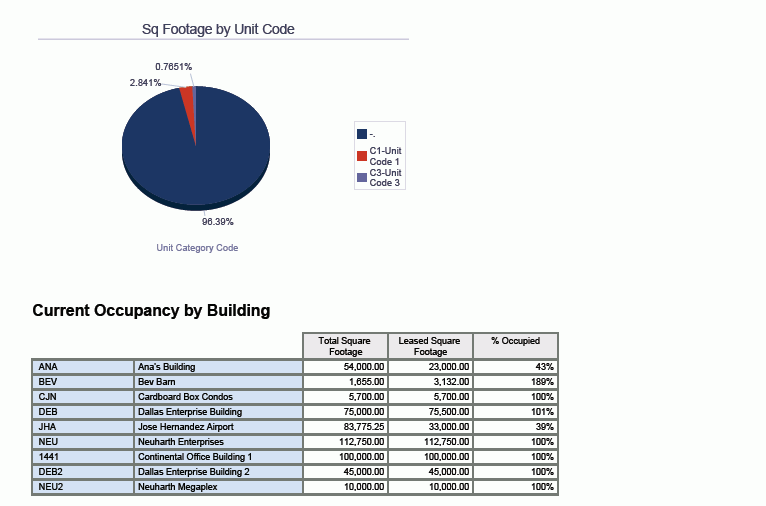
Square Footage by Unit Code (pie chart)
Current Occupancy by Building (table)
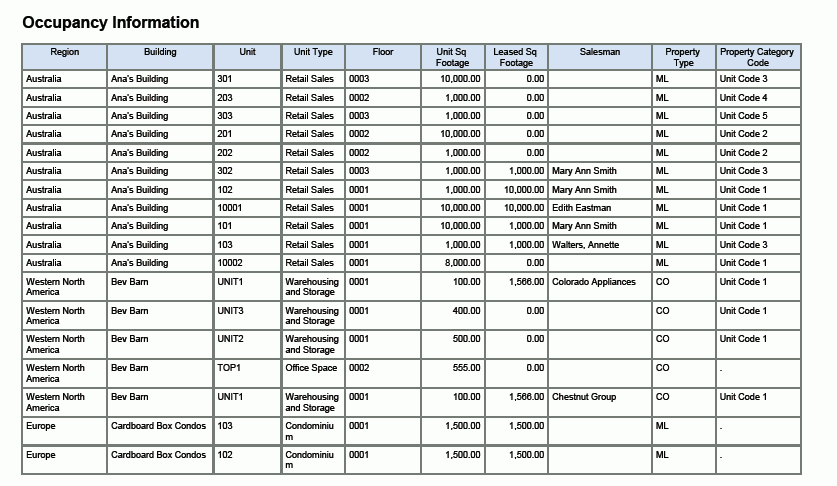
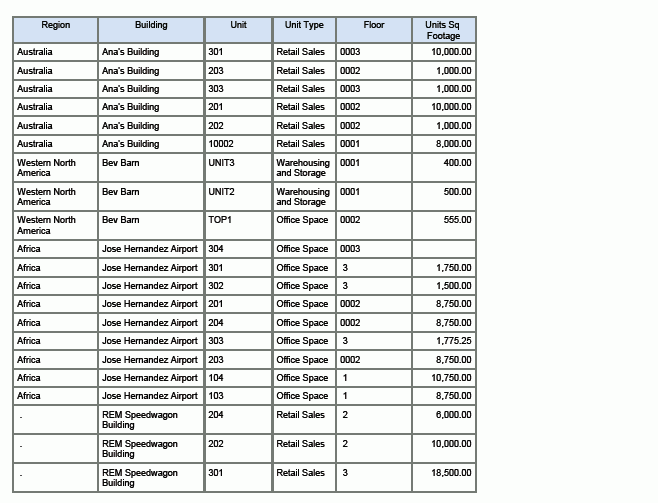
Occupancy Information (table)
Vacant Units (table)
The Occupancy Information table component contains drill back functionality as described in the following table:
Functionality |
Value |
|---|---|
Table column containing drill back link |
Unit |
Table columns passed to application |
Building, Unit |
Application called |
Unit Search (P15217) |
Form called |
W15217A |
Version called |
ZJDE0001 |
The following report was generated by deselecting the Display Billing Codes field.