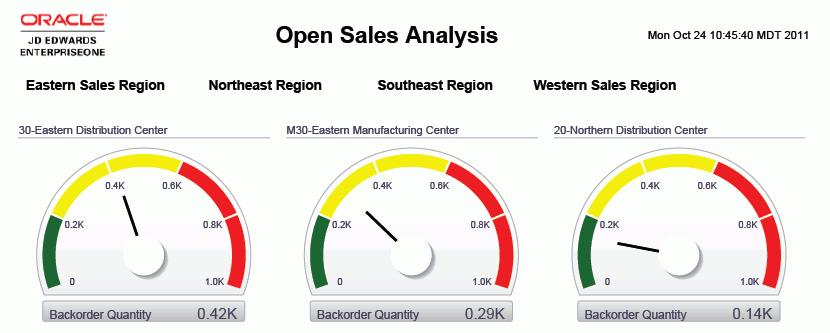
Open Sales Analysis
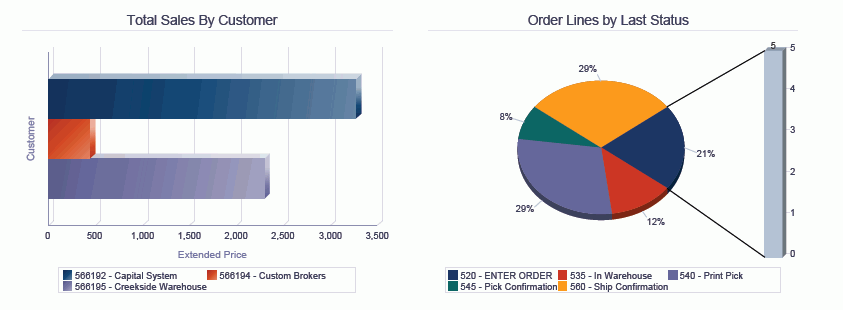
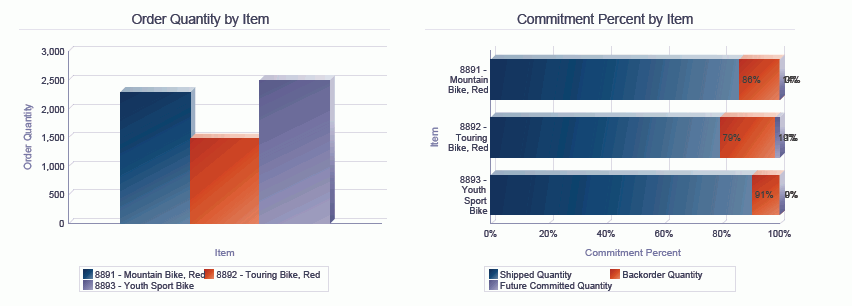
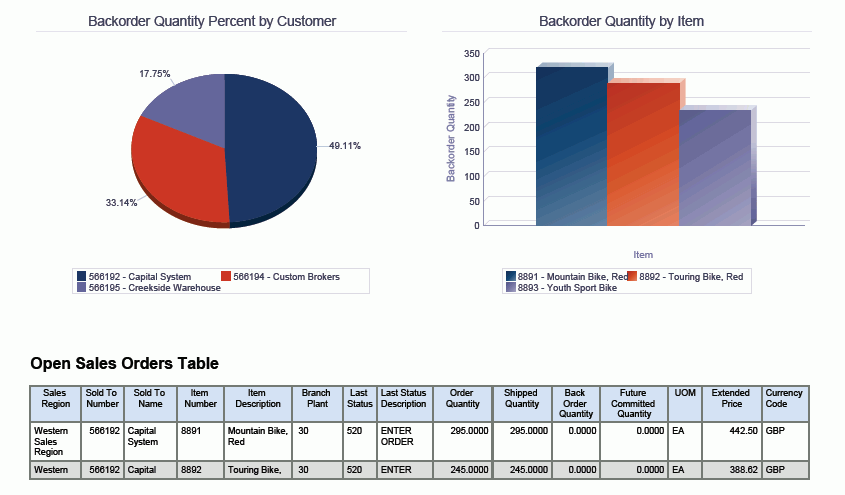
The Open Sales Analysis enables you to view open sales orders using region information as a filter. The Backorder Quantity dials display the level of backorders and the value for each branch plant within a region. The Total Sales by Customer bar chart enables you to compare the sales volumes for different customers within the selected region. The Order Lines by Last Status pie chart enables you to view the percentage of order lines that are at each status in the sales order cycle. The Order Quantity by Item bar chart enables you to view the total quantity of an item that is on open sales order lines for the selected region. The Commitment Percent by Item bar chart displays the percent of the total open quantity of an item that is included in each commitment category. The Backorder Quantity Percent by Customer pie chart displays the percent of the total backorder quantity for each customer. The Backorder Quantity by Item bar chart enables you to view the quantity of an item that is on backorder. The Open Sales Orders Table displays the sales order detail lines that were included in the selected region.
This report contains the following components:
Backorder Quantity by Branch Plant (gauges)
Total Sales by Customer (horizontal bar graph)
Order Lines by Last Status (pie chart)
Order Quantity by Item (bar graph)
Commitment Percentage by Item (horizontal bar graph)
Backorder Quantity Percentage by Customer (pie chart)
Backorder Quantity by Item (bar graph)
Open Sales Orders Table
The Open Sales Orders table component contains drill back functionality as described in the following table:
Functionality |
Value |
|---|---|
Table column containing drill back link |
Item Number |
Table columns passed to application |
Sold To Number, Item Number, Order Number |
Application called |
Sales Order Entry (P42101) |
Form called |
W42101C |
Version called |
ZJDE0001 |