Outbound Agreement Status Analysis
The Outbound Agreement Status Analysis report enables you to analyze the statuses of different outbound inventory agreements. The report contains the following components:
Component |
Description |
|---|---|
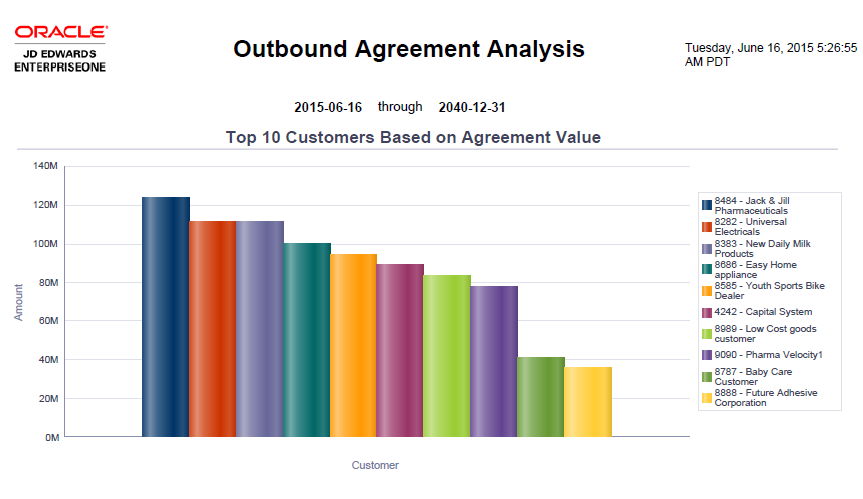
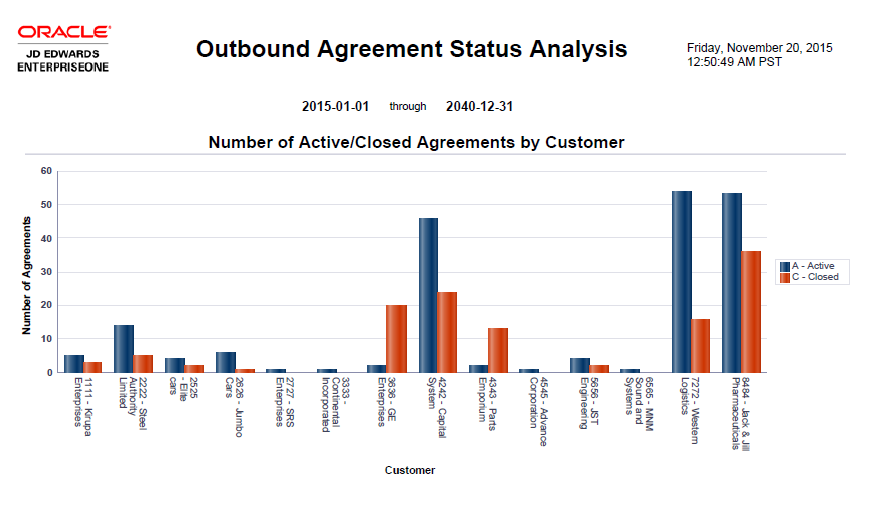
Number of Active/Closed Agreements by Customer (bar graph) |
This graph enables you to review and compare the number of active and closed outbound inventory agreements for different customers. |
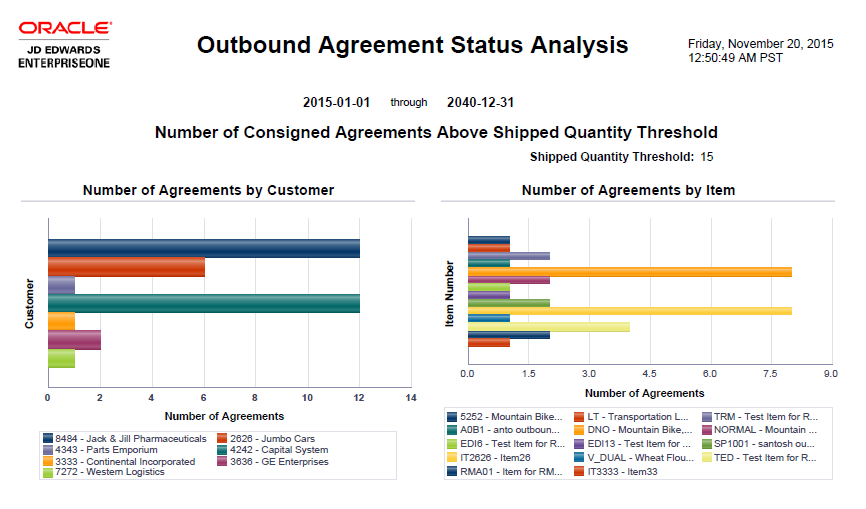
Number of Consigned Agreements Above Shipped Quantity Threshold - Number of Agreements by Customer (bar graph) |
This graph enables you to review the agreements with different customers, which have crossed the shipped quantity threshold. |
Number of Consigned Agreements Above Shipped Quantity Threshold - Number of Agreements by Item (bar graph) |
This graph enables you to review the agreements with different items, which have crossed the shipped quantity threshold. |
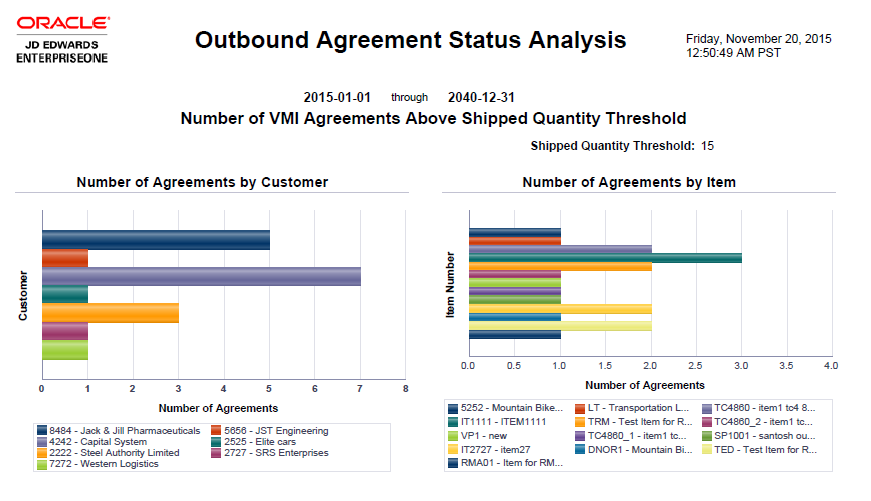
Number of VMI Agreements Above Shipped Quantity Threshold - Number of Agreements by Customer (bar graph) |
This graph enables you to review the agreements with different customers, which have crossed the shipped quantity threshold. Shipped Quantity Threshold is a value that represents the percentage of agreement quantity which is compared against total shipped quantity from an agreement. |
Number of VMI Agreements Above Shipped Quantity Threshold - Number of Agreements by Item (bar graph) |
This graph enables you to review the agreements with different items, which have crossed the shipped quantity threshold. |
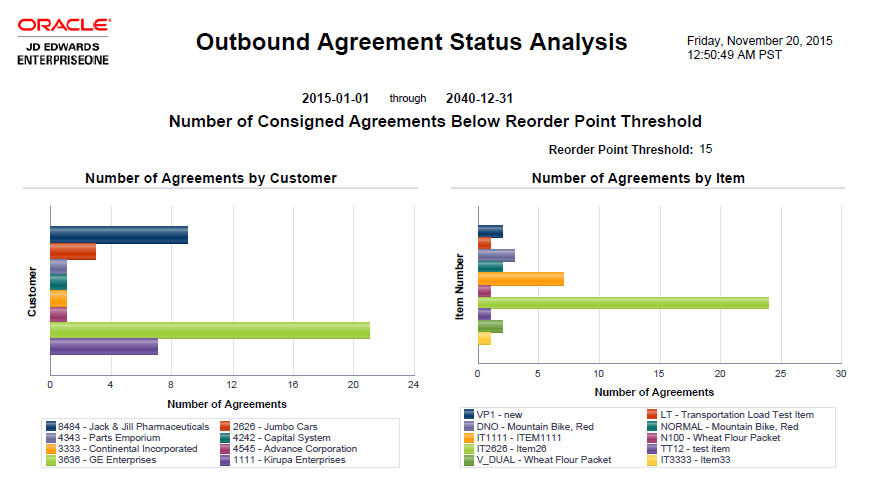
Number of Consigned Agreements Below Reorder Point Threshold - Number of Agreements by Customer (bar graph) |
This graph enables you to review the agreements with different customers, which are below the reorder point threshold. Reorder Point Threshold is a value that represents the percentage of reorder point of an agreement, which is compared against total shipped quantity from the agreement that is available for consumption at the customer's location. You can optionally add committed and in-transit quantity to the shipped quantity. |
Number of Consigned Agreements Below Reorder Point Threshold - Number of Agreements by Item (bar graph) |
This graph enables you to review the agreements with different items, which are below the reorder point threshold. |
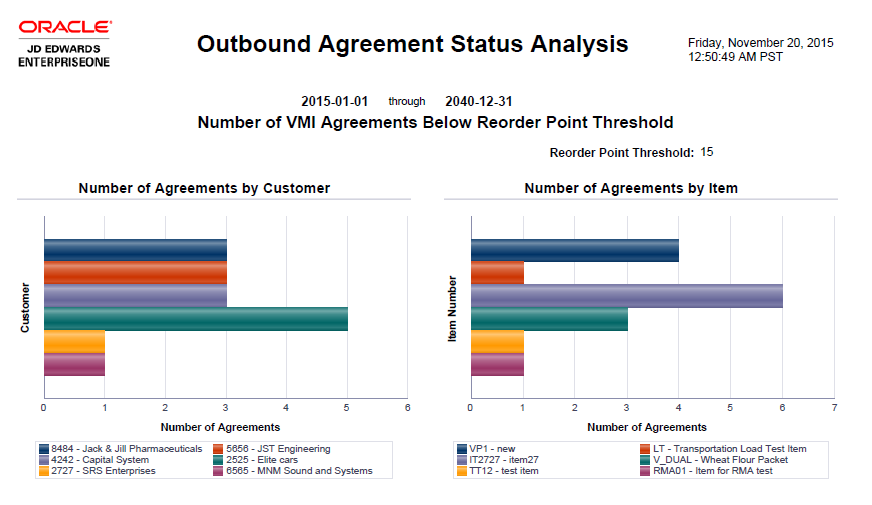
Number of VMI Agreements Below Reorder Point Threshold - Number of Agreements by Customer (bar graph) |
This graph enables you to review the agreements with different customers, which are below the reorder point threshold. |
Number of VMI Agreements Below Reorder Point Threshold - Number of Agreements by Item (bar graph) |
This graph enables you to review the agreements with different items, which are below the reorder point threshold. |
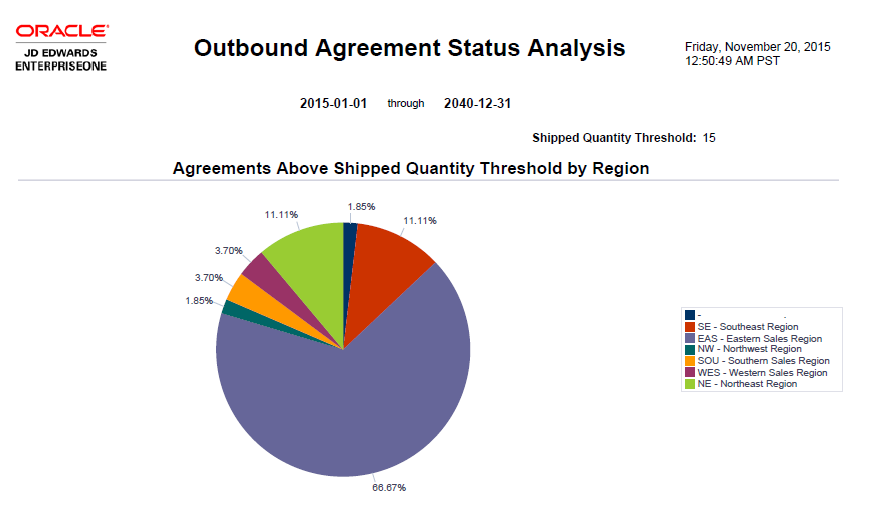
Agreements Above Shipped Quantity Threshold by Region (pie chart) |
This chart enables you to review the percentage of agreements that have crossed the shipped quantity threshold across different regions. |
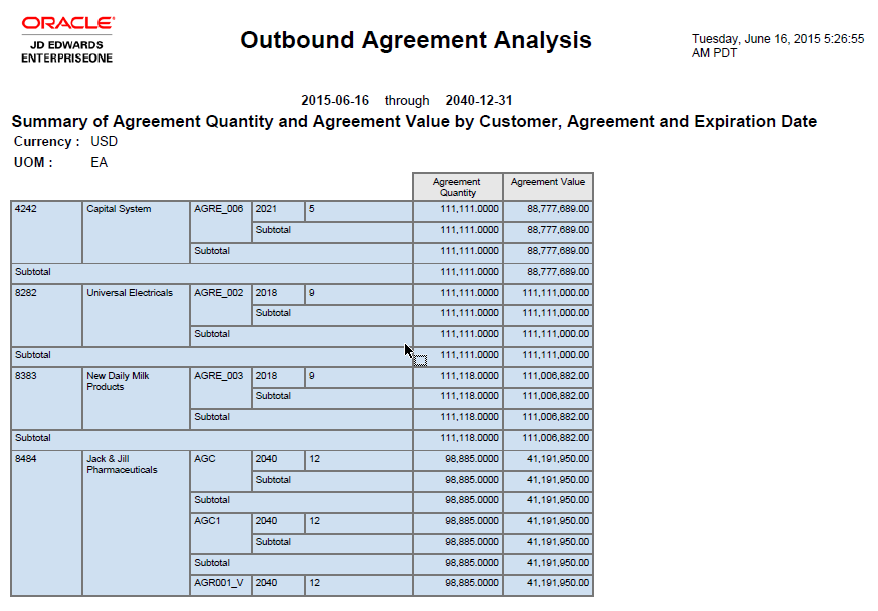
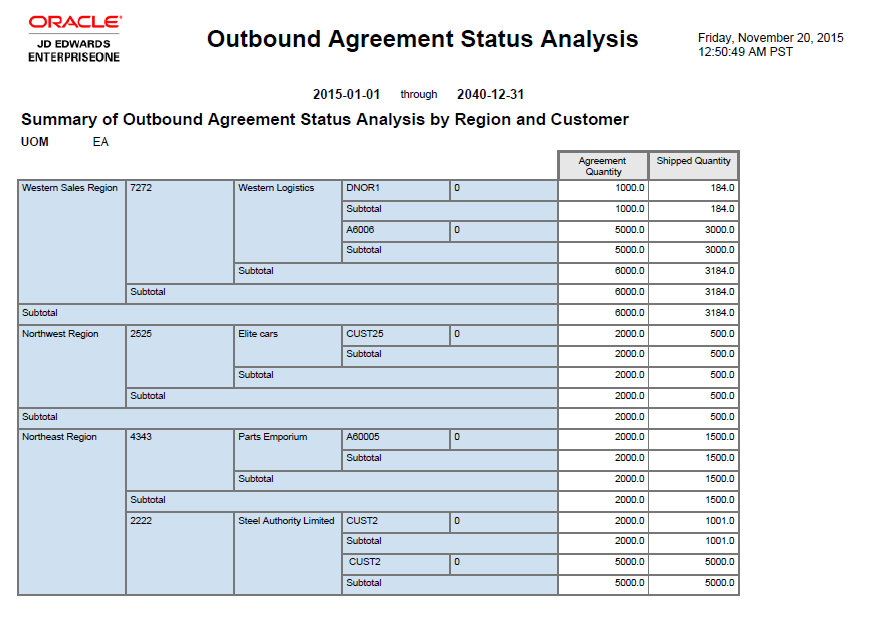
Summary of Outbound Agreement Status Analysis by Region and Customer (table) |
This table enables you to review agreement quantity and shipped quantity for different regions and customers. |
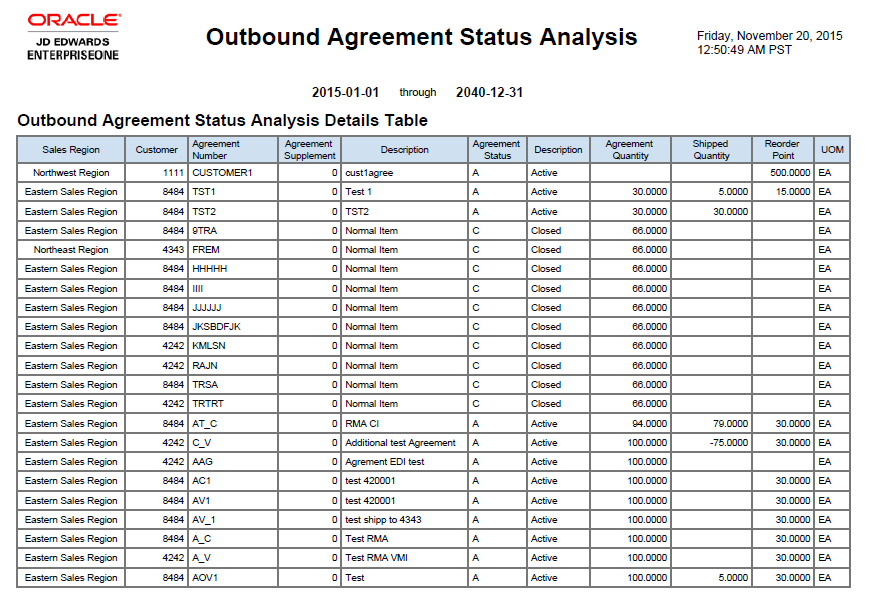
Outbound Agreement Status Analysis Details Table (table) |
This table provides details of outbound agreement status analysis and lists sales region, customer, agreement number, agreement supplement, agreement status, agreement quantity, shipped quantity, and reorder point. |