Outbound Sales Analysis
The Outbound Sales Analysis report enables you to analyze sales values for consigned and customer owned vendor managed inventory transactions. The report contains the following components:
Component |
Description |
|---|---|
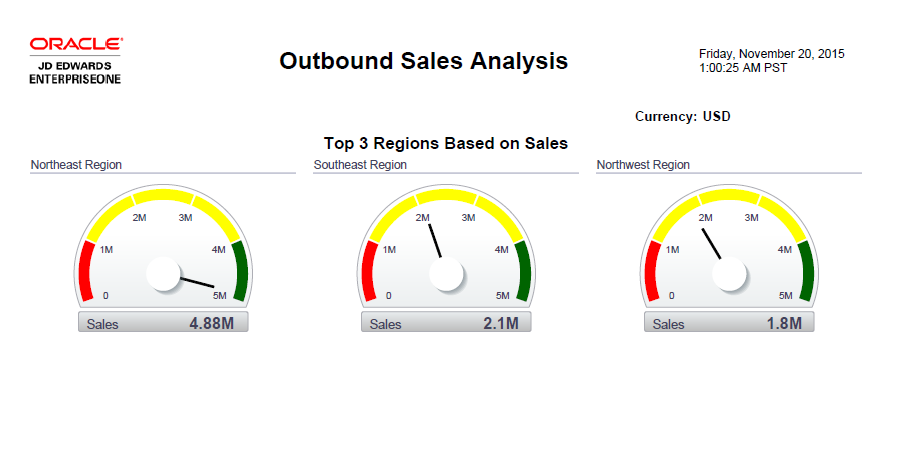
Top 3 Regions Based on Sales |
This chart enables you to view your top 3 regions in terms of outbound inventory sales values. |
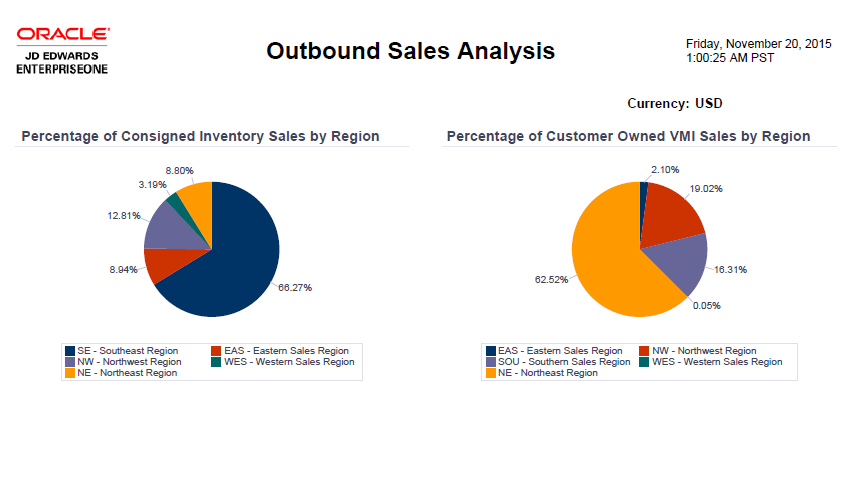
Percentage of Consigned Inventory Sales by Region (pie chart) |
This chart enables you to review the distribution of consigned inventory sales in different regions. |
Percentage of Customer Owned VMI Sales by Region (pie chart) |
This chart enables you to review the distribution of customer owned VMI sales in different regions. |
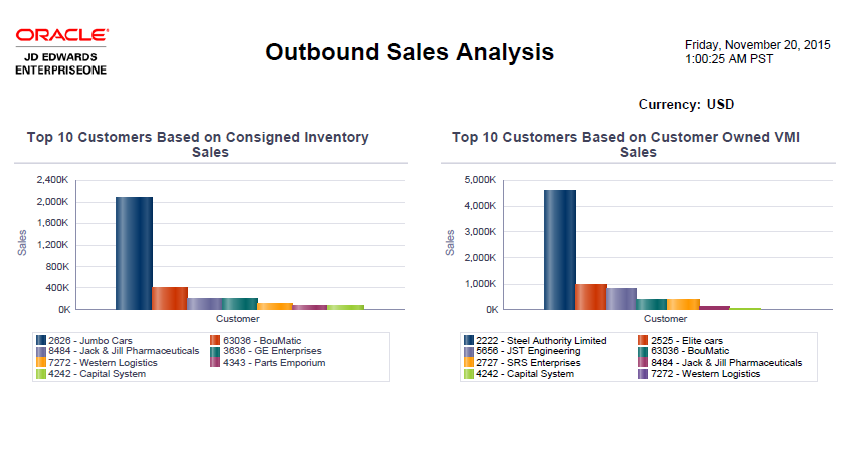
Top 10 Customers Based on Consigned Inventory Sales (bar graph) |
This graph enables you to view your top 10 customers in terms of consigned inventory sales value. |
Top 10 Customers Based on Customer Owned VMI Sales (bar graph) |
This graph enables you to view your top 10 customers in terms of customer owned VMI sales value. |
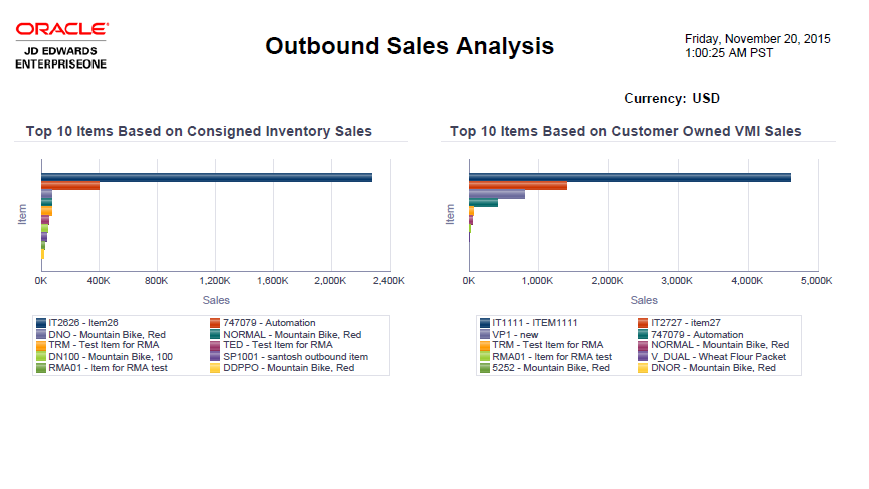
Top 10 Items Based on Consigned Inventory Sales (bar graph) |
This graph enables you to view your top 10 items in terms of consigned inventory sales value. |
Top 10 Items Based on Customer Owned VMI Sales (bar graph) |
This graph enables you to view your top 10 items in terms of customer owned VMI sales value. |
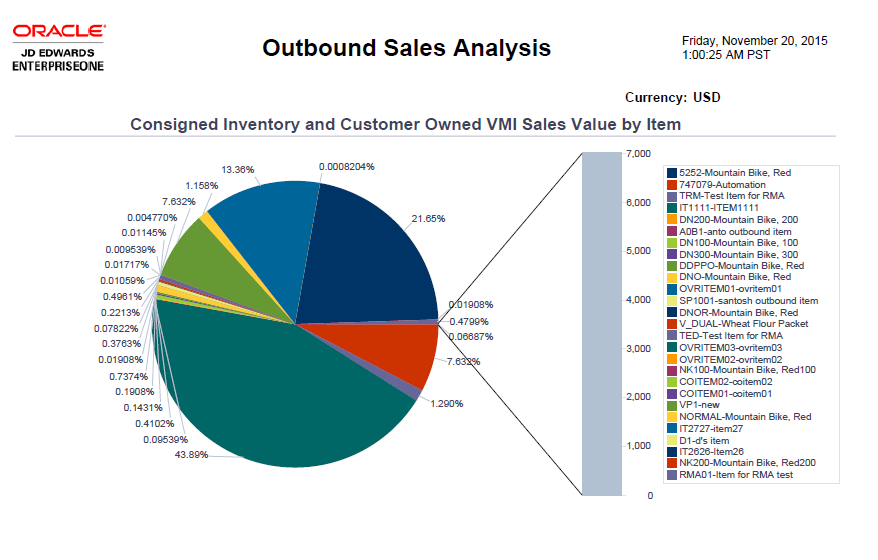
Consigned Inventory and Customer Owned Sales Value by Item (pie chart) |
This chart enables you to review the distribution of consigned inventory and customer owned VMI sales for different items. |
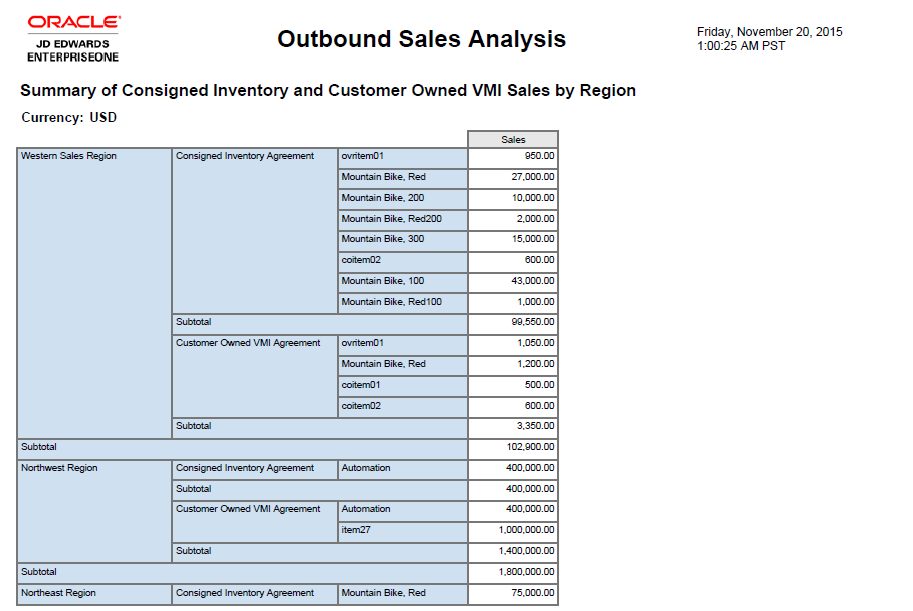
Summary of Consigned Inventory and Customer Owned Sales by Region (table) |
This table enables you to review consigned inventory and customer owned VMI sales values for different regions. |
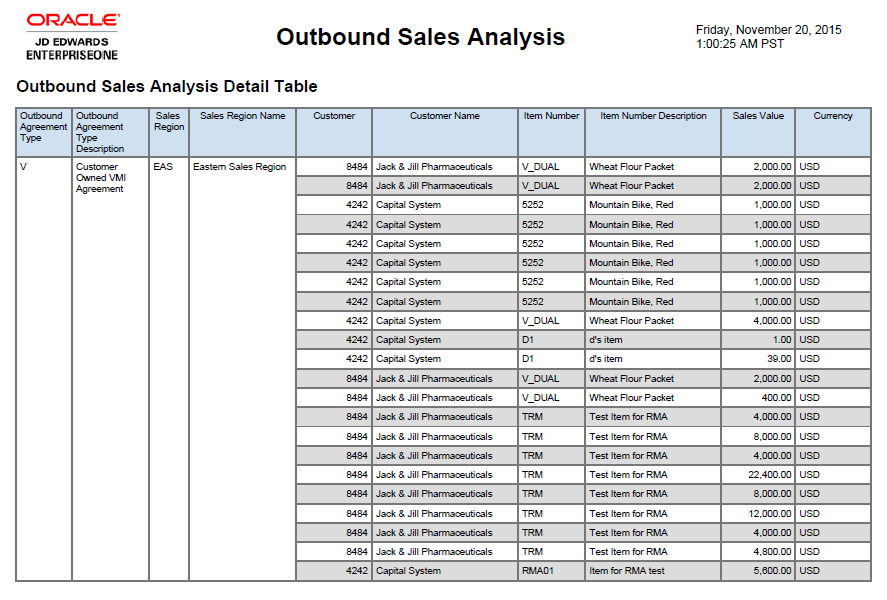
Outbound Sales Analysis Detail Table (table) |
This table provides details of outbound inventory sales analysis and lists agreement type, sales region, customer name, item number, and sales value. |