Packaged Load Analysis Report
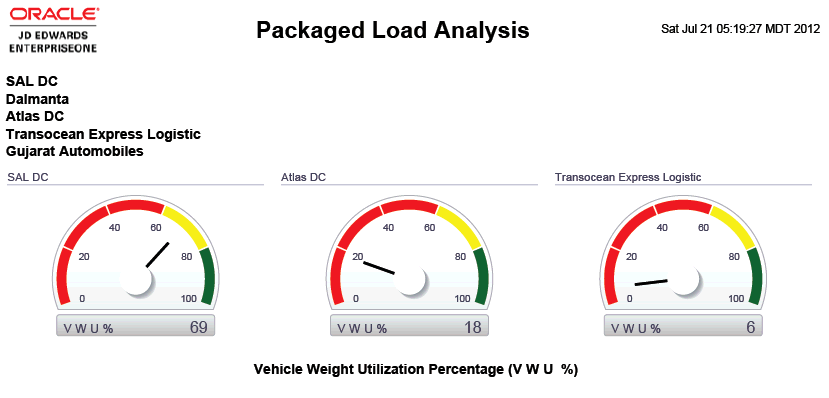
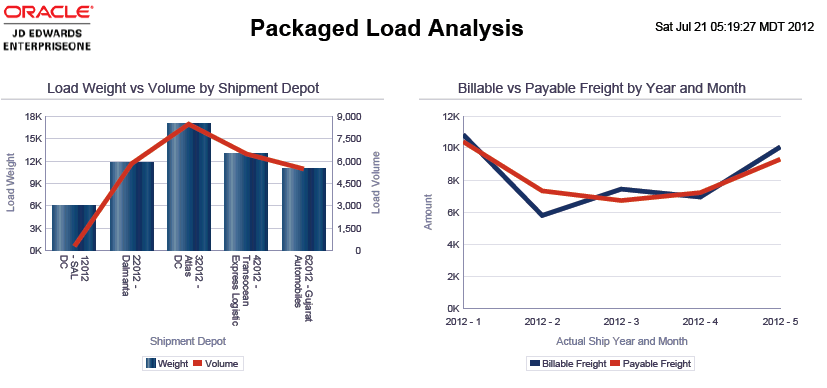
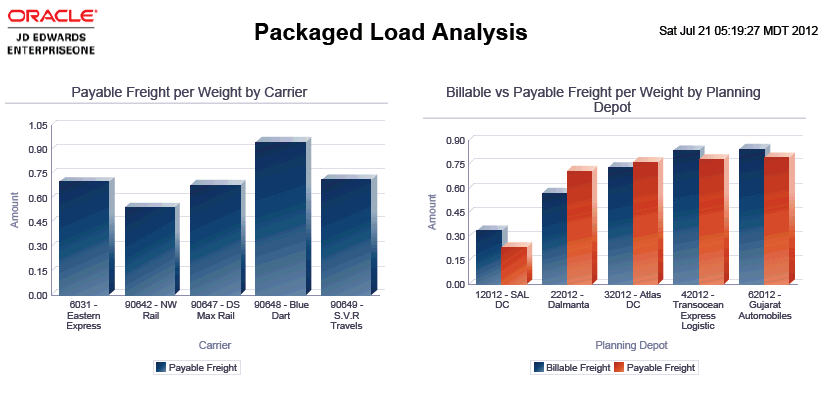
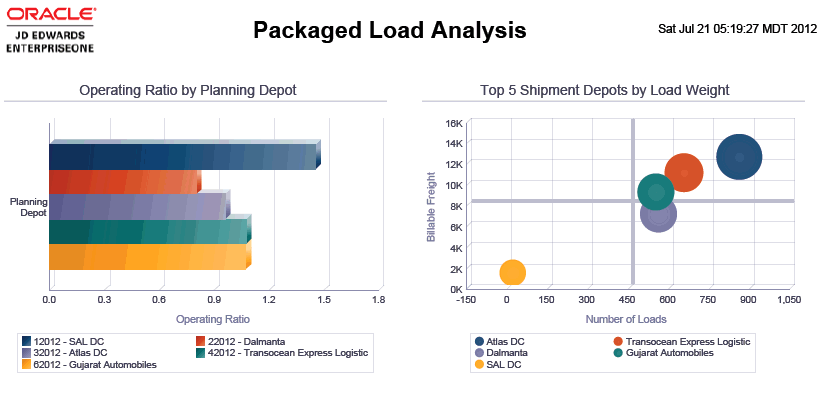
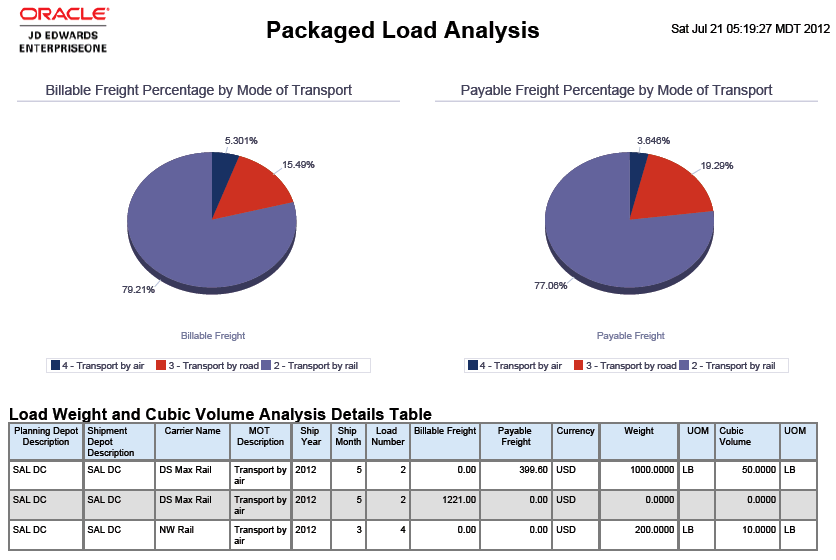
The Packaged Load Analysis report enables you to view load information using shipment or planning depot as a filter. The Vehicle Weight Utilization Percentage gauges displays the three shipment depots with the lowest vehicle utilization percentages. The Load Weight vs. Volume by Shipment Depot bar-line combination graph enables you to compare the load weight to the load volume for selected shipment depots. The Billable vs. Payable Freight by Year and Month line graph enables you to compare billable and payable freight charges for the same time period. The Payable Freight per Weight by Carrier bar graph enables you to compare payable freight per a defined unit of measure for selected carriers. The Billable vs. Payable Freight per Weight by Planning Depot bar graph enables you to compare billable and payable freight charges per a defined unit of measure for selected planning depots. The Operating Ratio by Planning Depot bar graph enables you to compare operating ratios for selected planning depots. The Top 5 Shipment Depots by Load Weight bubble chart enables you to plot the top 5 shipment depots by load weight in relationship to billable freight charges and number of loads. The Billable Freight Percentage by Mode of Transport pie chart enables you to view the distribution of billable freight charges by mode of transport. The Payable Freight Percentage by Mode of Transport pie chart enables you to view the distribution of payable freight charges by mode of transport. The Load Weight and Cubic Volume Analysis Details Table displays all the historical load weight and cubic volume detail records that were used to create the charts for the selected planning or shipment depot.
This report contains the following components:
Vehicle Weight Utilization Percentage (gauges)
Load Weight vs. Volume by Shipment Depot (bar-line graph combination)
Billable vs. Payable Freight by Year and Month (line graph)
Payable Freight per Weight by Carrier (bar graph)
Billable vs. Payable Freight per Weight by Planning Depot (bar graph)
Operating Ratio by Planning Depot (bar graph)
Top 5 Shipment Depots by Load Weight (bubble chart)
Billable Freight Percentage by Mode of Transport (pie chart)
Payable Freight Percentage by Mode of Transport (pie chart)
Load Weight and Cubic Volume Analysis Details Table
