Payment Analysis
This report enables you to fully analyze your payments. You can analyze your payments by Approver, Region (address book category code 1), Business Unit, Payee, Supplier, and Bank Account. See information on discounts taken and lost or a trend of your payments over a period. Use this report to fully understand how your payment process affects your business. View the data for multiple companies and business units or focus on a single business unit or region. This analysis can be done for multiple fiscal years, periods, or both.
This report gives you complete control over the information shown in the graphs and table by providing filtering by Region (address category code 1). This report contains the following components:
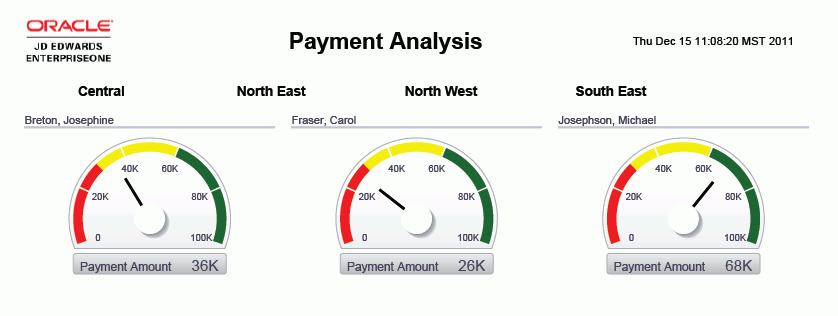
Payment Amount by Approver (gauges)
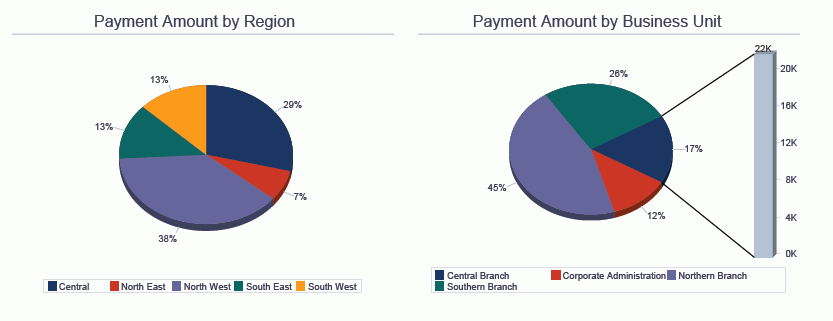
Payment Amount by Region (pie chart)
Payment Amount by Business Unit (pie chart)
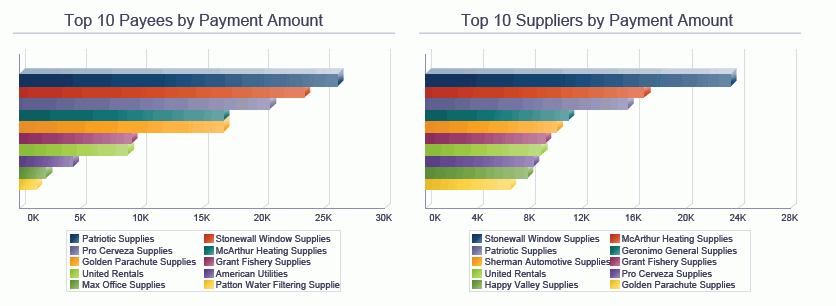
Top 10 Payees by Payment Amount (horizontal bar graph)
Top 10 Suppliers by Payment Amount (horizontal bar graph)
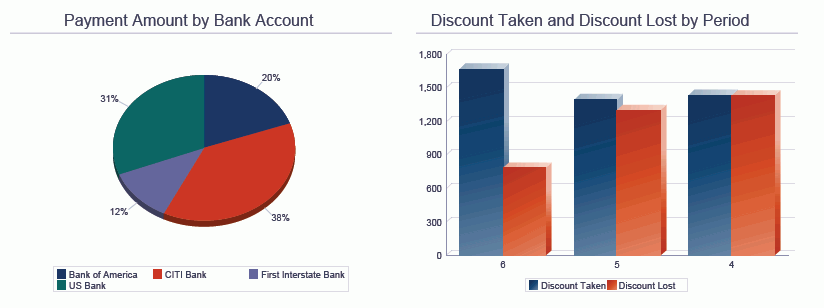
Payment Amount by Bank Account (pie chart)
Discount Taken and Discount Lost by Period (bar graph)
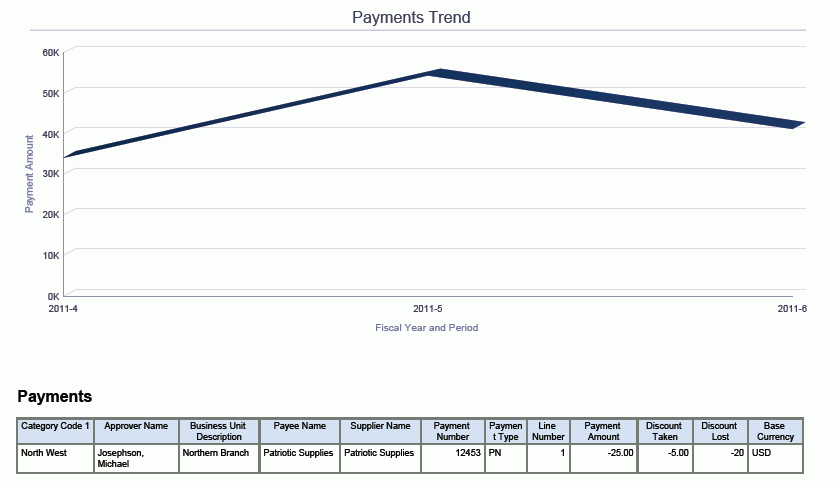
Payments Trend (line graph)
Payments Detail (table)
The Payments Detail table component contains drill back functionality as described in the following table:
Functionality |
Value |
|---|---|
Table column containing drill back link |
Payment Number |
Table columns passed to application |
Payee Number |
Application called |
A/P Manual Payments (P0413M) |
Form called |
W0413MB |
Version called |
ZJDE0001 |
The following report was generated by selecting a large group of suppliers for company 00001 for periods four through six of fiscal year 11. It shows the user a broad view of the Payment activity across the periods.