Purchase Order Analysis
The Purchase Order Analysis report provides complete control over the information shown on the gauges, graphs, charts, and tables. By selecting a Branch/Plant or supplier on the report, you can change the data displayed in the report components. This report provides some key metrics from the other reports in one cumulative view to determine when orders will be filled, so you can inform customers or provide information to employees about item they ordered. This report also provides a comparison of the promised date and the receipt date. Use this report to analyze how well vendors meet their shipping schedules based on their history. This report contains these report components:
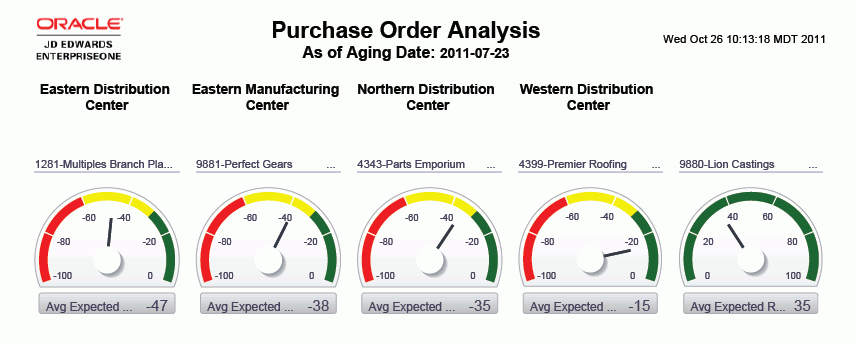
Average Expected Receipts Quantity based on Supplier by Branch/Plant (gauges)
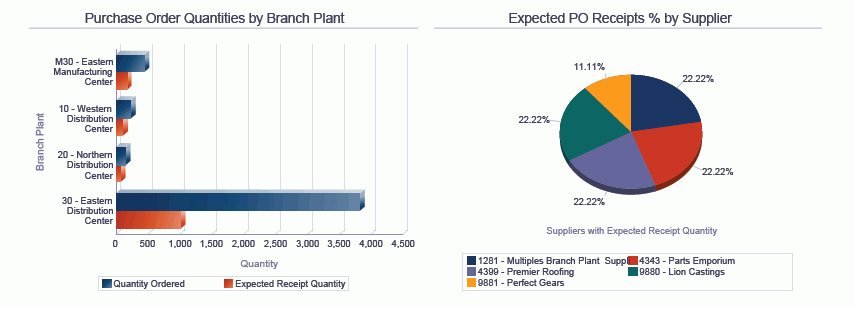
Purchase Order Quantities by Branch Plant (horizontal bar graph)
Expected PO Receipts Percentage by Supplier (pie chart)
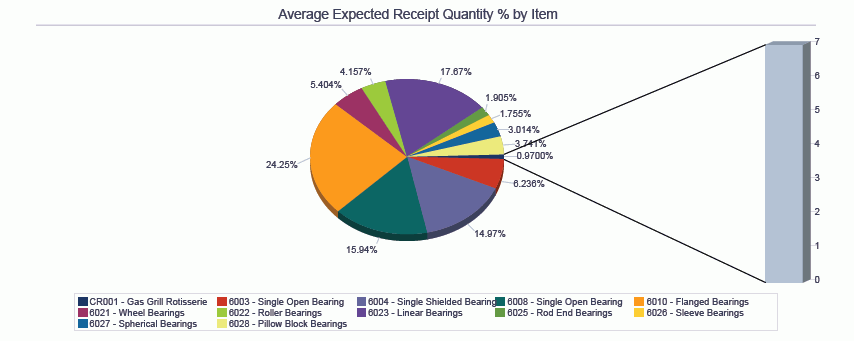
Average Expected Receipt Quantity Percentage by Item (pie chart)
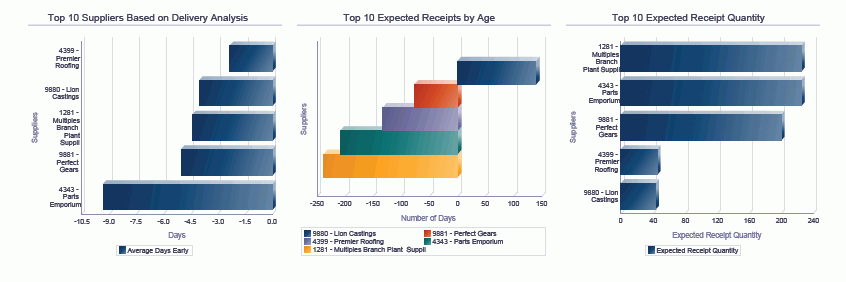
Top 10 Suppliers Based on Delivery Analysis (horizontal bar graph)
Top 10 Expected Receipts by Age (horizontal bar graph)
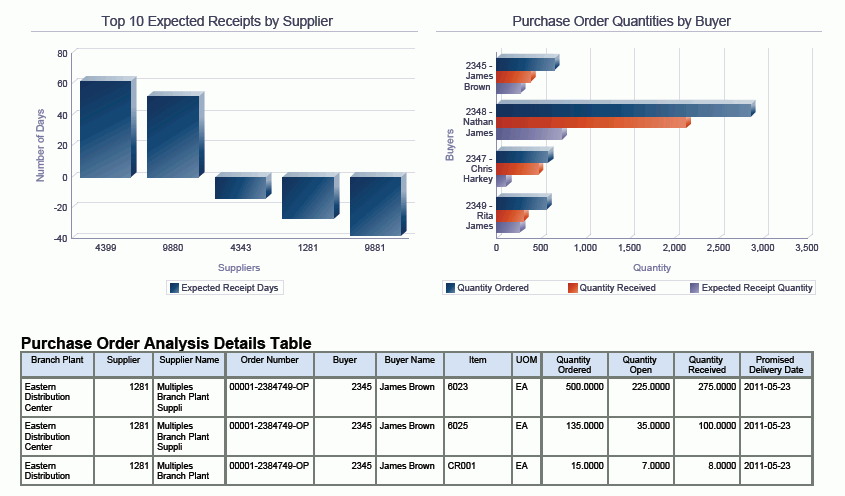
Top 10 Expected Receipt Quantity (bar graph)
Top 10 Expected Receipts by Supplier (bar graph)
Purchase Order Quantities by Buyer (horizontal bar graph)
Purchase Order Analysis Details Table
The Purchase Order Analysis Details table component contains drill back functionality as described in the following table:
Functionality |
Value |
|---|---|
Table column containing drill back link |
Order Number |
Table columns passed to application |
Business Unit, Order Type |
Application called |
Purchase Orders (P4310) |
Form called |
W4310I |
Version called |
ZJDE0001 |