Purchase Order Receipts Analysis
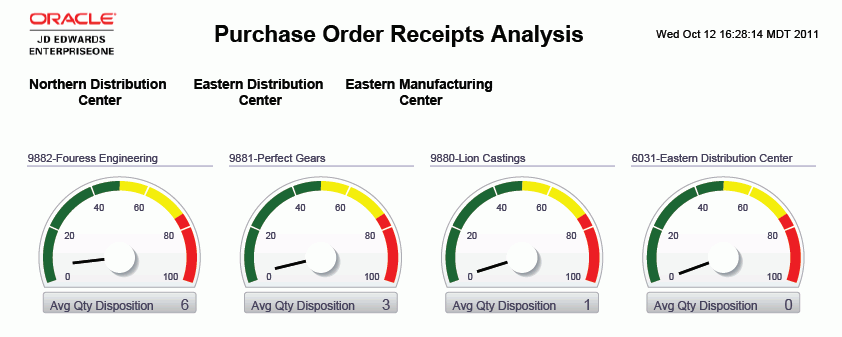
The Purchase Order Receipts Analysis report provides complete control over the information shown on the gauges, graphs, charts, and tables. Select one of the suppliers on the gauges to display information related to that specific supplier. The purpose of this report is to provide some key metrics from the other reports in one cumulative view of quantity analysis and received not vouchered of goods. The Purchase Order Receipts Analysis report contains these report components:
Average Quantity Disposition by Supplier (gauges)
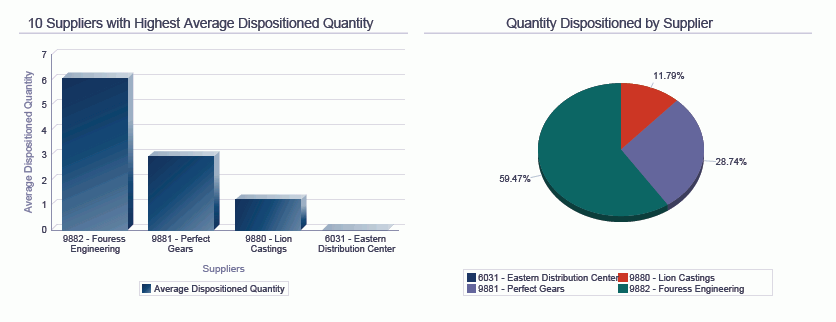
10 Suppliers with Highest Average Dispositioned Quantity (bar graph)
Quantity Dispositioned by Supplier (pie chart)
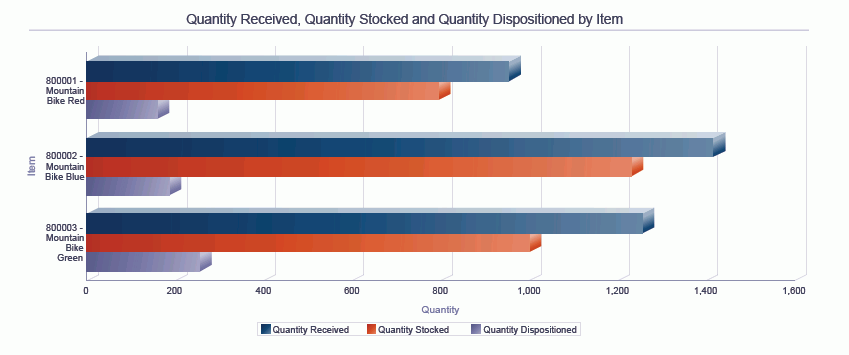
Quantity Received, Quantity Stocked, and Quantity Dispositioned by Item (horizontal bar graph)
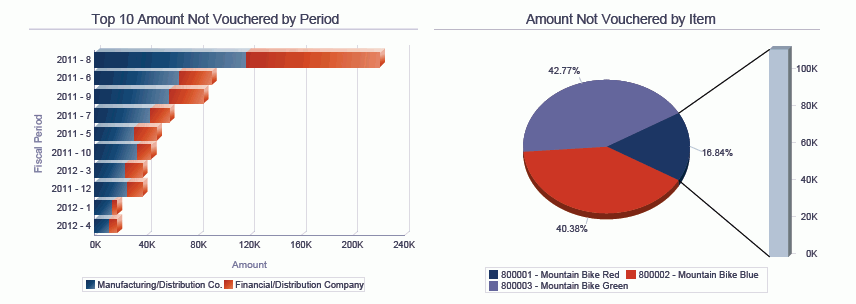
Top 10 Amount Not Vouchered by Period (horizontal bar graph)
Amount Not Vouchered by Item (pie chart)
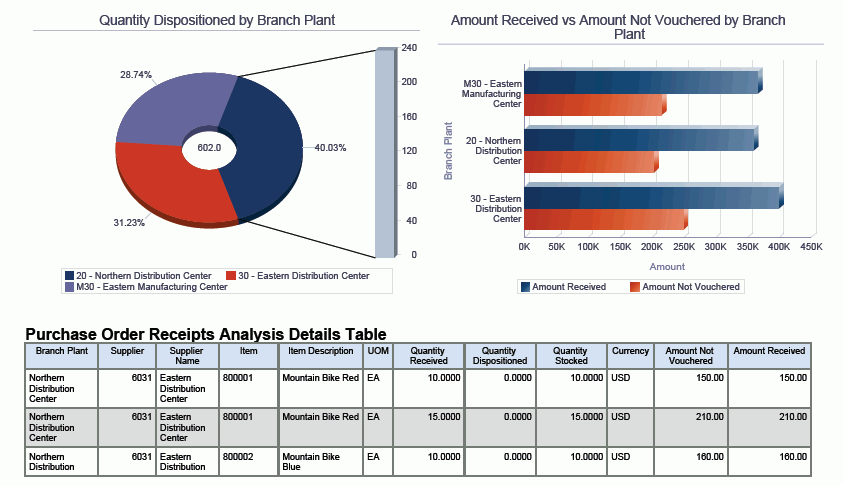
Quantity Dispositioned by Branch Plant (donut chart)
Amount Received vs. Amount Not Vouchered by Branch Plant
Purchase Order Receipts Analysis Details Table
The Purchase Order Receipts Analysis Details table component contains drill back functionality as described in the following table:
Functionality |
Value |
|---|---|
Table column containing drill back link |
Item Number |
Table columns passed to application |
3rd Item Number |
Application called |
PO Receipts (P4312) |
Form called |
W4312F |
Version called |
ZJDE0001 |