Retained Amount Analysis
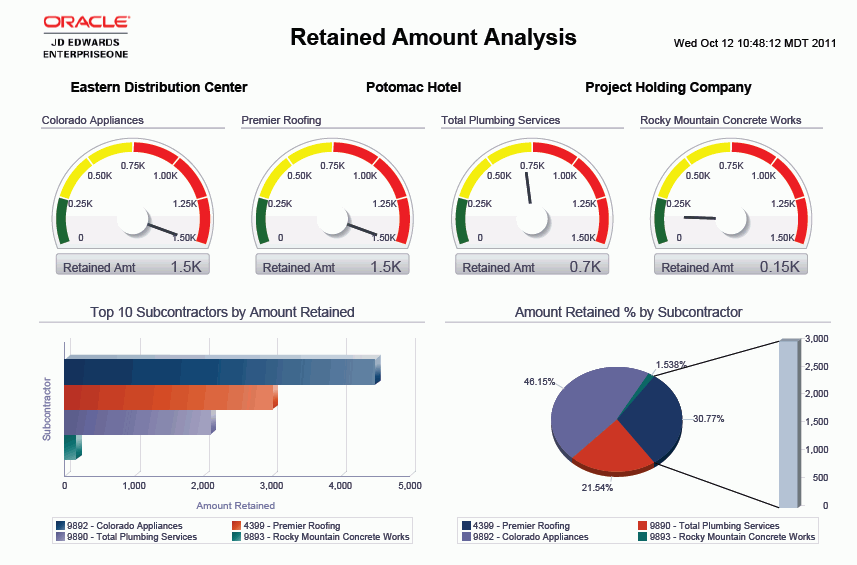
The Retained Amount Analysis report provides complete control over the information shown in the gauges, graphs, charts, and tables. The purpose of this report is to provide some key metrics from the other reports in one cumulative view of subcontract service order analysis. This report contains these report components:
Retained Amount by Supplier by Branch Plant (gauges)
Top 10 Subcontractors by Amount Retained (horizontal bar graph)
Amount Retained Percentage by Subcontractor (pie chart)
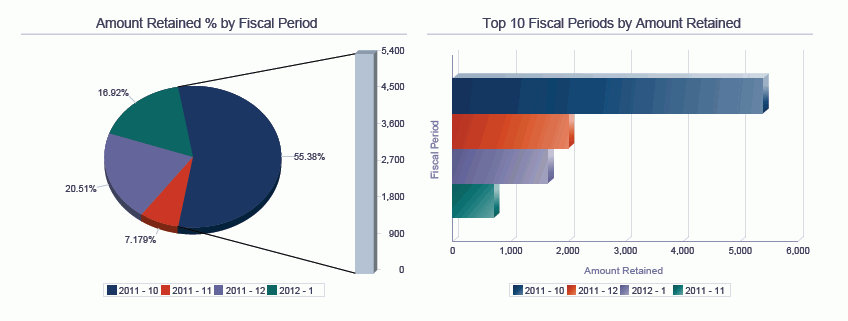
Amount Retained Percentage by Fiscal Period (pie chart)
Top 10 Fiscal Periods by Amount Retained (horizontal bar graph)
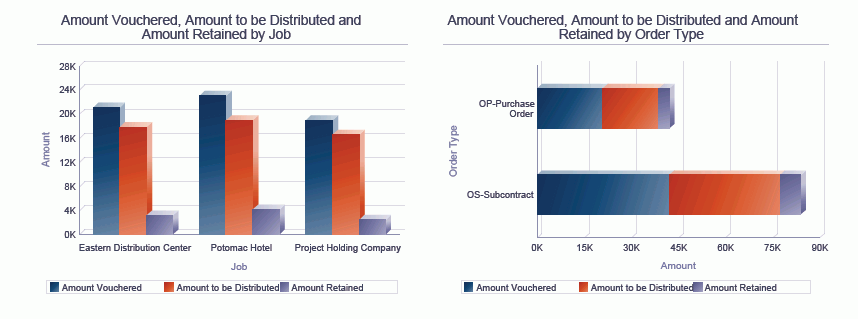
Amount Vouchered, Amount to be Distributed and Amount Retained by Job (bar graph)
Amount Vouchered, Amount to be Distributed and Amount Retained by Order Type (horizontal bar graph)
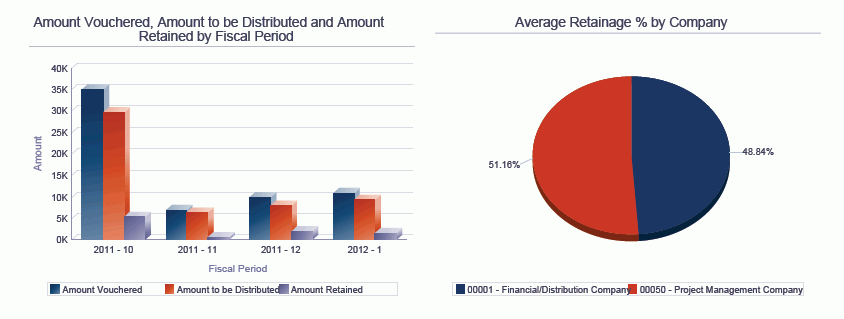
Amount Vouchered, Amount to be Distributed and Amount Retained by Fiscal Period (bar graph)
Average Retainage Percentage by Company (pie chart)
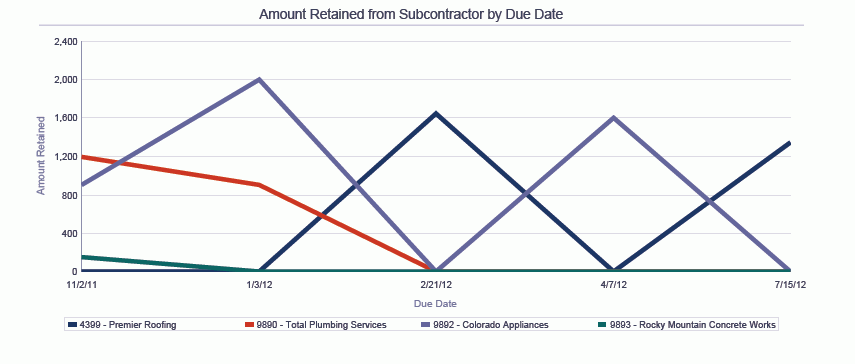
Amount Retained from Subcontractor by Due Date (line graph)
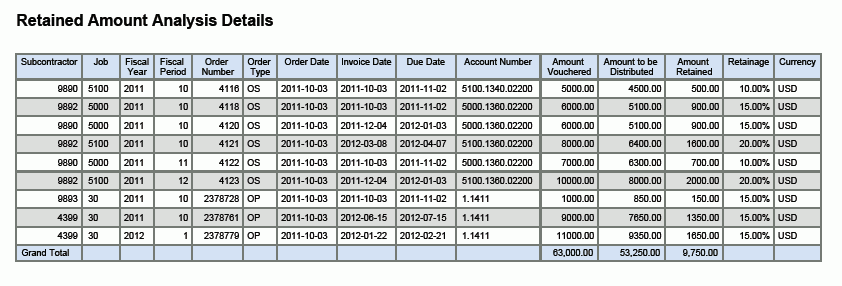
Retained Amount Analysis Details (table)
The Retained Amount Analysis Details table component contains drill back functionality as described in the following table:
Functionality |
Value |
|---|---|
Table column containing drill back link |
Order Number |
Table columns passed to application |
Business Unit, Order Type |
Application called |
Purchase Orders (P4310) |
Form called |
W4310I |
Version called |
ZJDE0001 |