Shipment Analysis Report
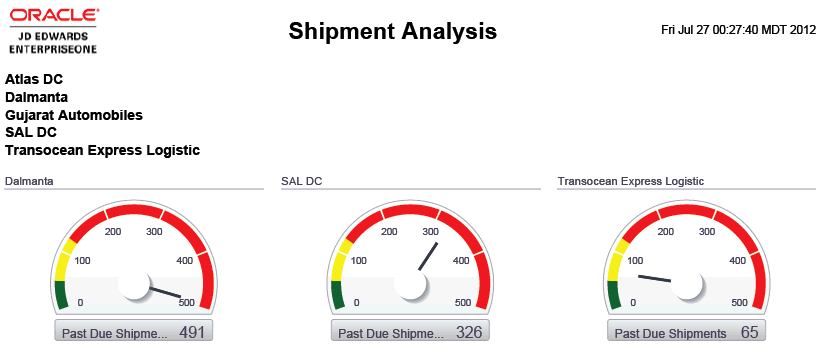
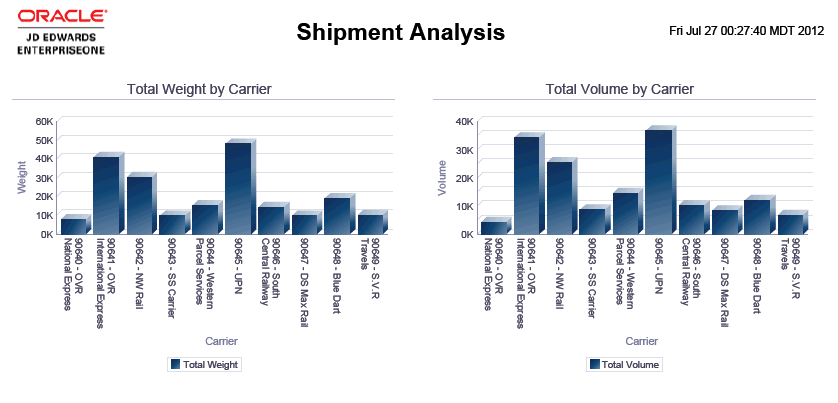
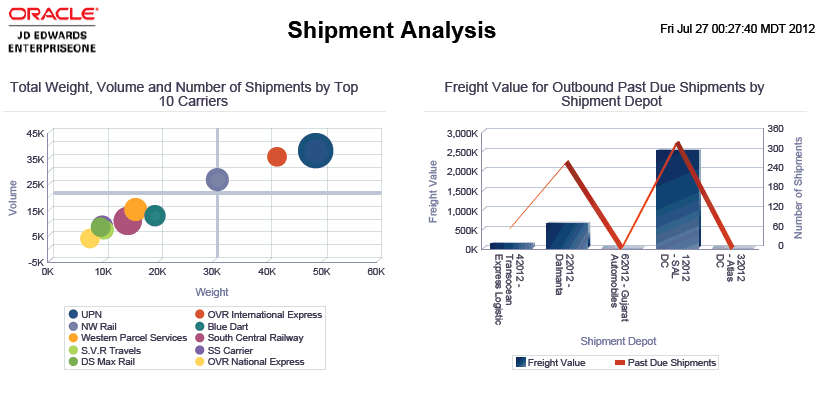
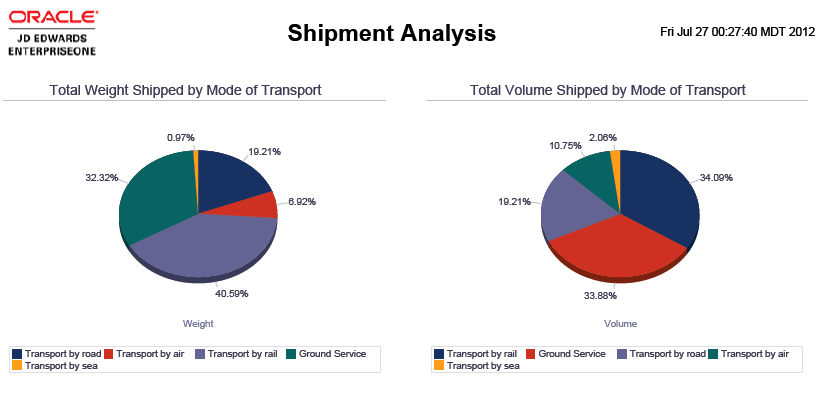
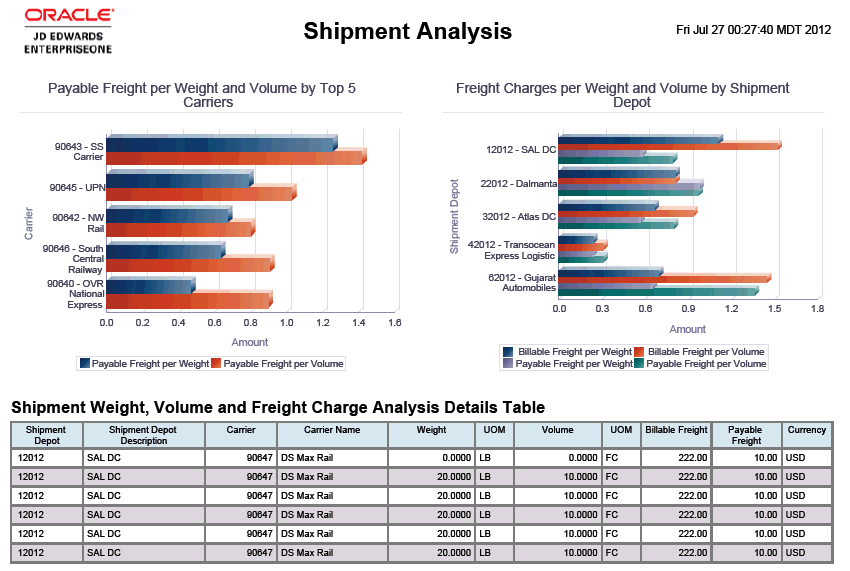
The Shipment Analysis report enables you to view shipment information using shipment depot as a filter. The Past Due Shipments gauges display the three shipment depots with the most past due shipments. The Total Weight by Carrier bar chart enables you to compare the amount of tonnage that each carrier has shipped for the selected shipment depot. The Total Volume by Carrier bar chart enables you to compare the amount of cubic volume that each carrier has shipped for the selected shipment depot. The Total Weight, Volume and Number of Shipments by Top 10 Carriers bubble chart enables you to plot the top ten carriers in relationship to the total number of shipments, weight, and volume for the selected shipment depot. The Freight Value for Outbound Past Due Shipments by Shipment Depot bar chart enables you to compare the value of the total number of shipments from each shipment depot that were shipped late. The Total Weight Shipped by Mode of Transport pie chart enables you to view the distribution of the shipment depot's total amount of shipped weight based upon mode of transport. The Total Volume Shipped by Mode of Transport pie chart enables you to view the distribution of the shipment depot's total amount of shipped volume based upon mode of transport. The Freight Charges per Weight and Volume by Top 5 Carriers bar chart displays information for the top 5 carriers based upon payable freight charges derived from the specified unit of measure for weight, volume, and currency. The Freight Charges per Weight and Volume by Shipment Depot bar chart displays the amount of billable and payable freight charges categorized by weight and volume for each selected shipment depot. The Shipment Weight, Volume, and Freight Charge Analysis Detail Table displays the shipment detail lines that were included in the selected shipment depot.
This report contains the following components:
Past Due Shipments (gauges)
Total Weight by Carrier (bar graph)
Total Volume by Carrier (bar graph)
Total Weight, Volume and Number of Shipments by Top 10 Carriers (bubble chart)
Freight Value for Outbound Past Due Shipments by Shipment Depot (bar-line combination graph)
Total Weight Shipped by Mode of Transport (pie chart)
Total Volume Shipped by Mode of Transport (pie chart)
Payable Freight per Weight and Volume by Top 5 Carriers (bar graph)
Freight Charges per Weight and Volume by Shipment Depot (bar graph)
Shipment Weight, Volume and Freight Charge Analysis Details Table
The Shipment Weight, Volume and Freight Charge Analysis Details table component contains drill back functionality as described in the following table:
Functionality |
Value |
|---|---|
Table column containing drill back link |
Shipment Depot |
Table columns passed to application |
Shipment Number |
Application called |
Work with Shipments (P4915) |
Form called |
W4915B |
Version called |
ZJDE0001 |
