Supplier Cost Analysis
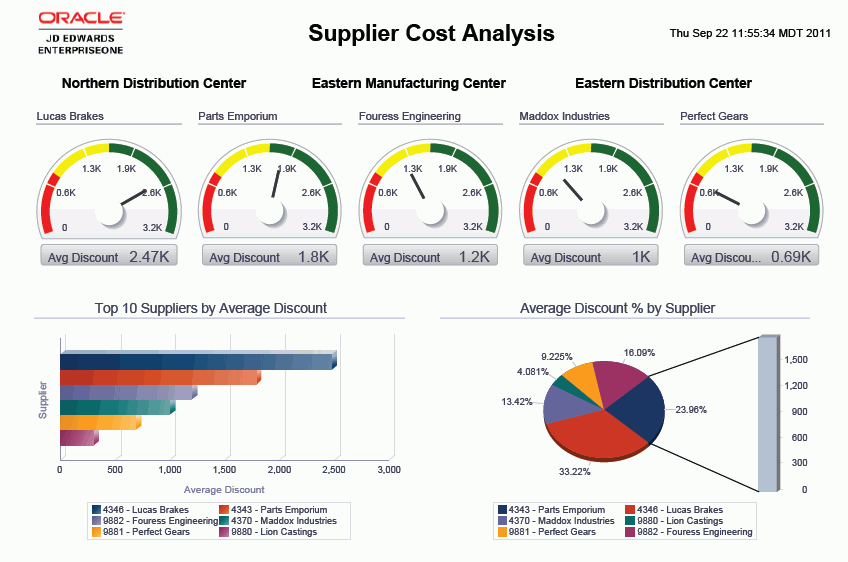
The Supplier Cost Analysis report provides you complete control over the information shown in the gauges, graphs, charts, and tables. You can select a specific supplier or branch/plant to see that specific data in the other report components. The purpose of this report is to provide some key metrics from the other reports in one cumulative view of quantity analysis and the received not vouchered goods. This report contains these report components:
Average Discount by Supplier and Branch Plant (five gauges)
Top Ten Suppliers by Average Discount (horizontal bar graph)
Average Discount Percentage by Supplier (pie chart)
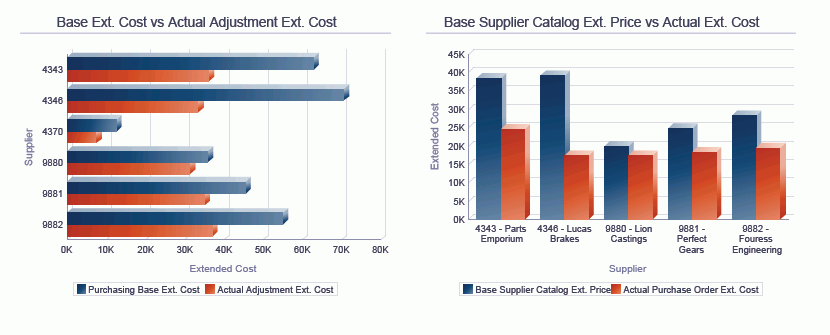
Base Extended Cost vs. Actual Adjustment Extended Cost by Supplier (horizontal bar graph)
Base Supplier Catalog Extended Price vs. Actual Extended Cost by Supplier (bar graph)
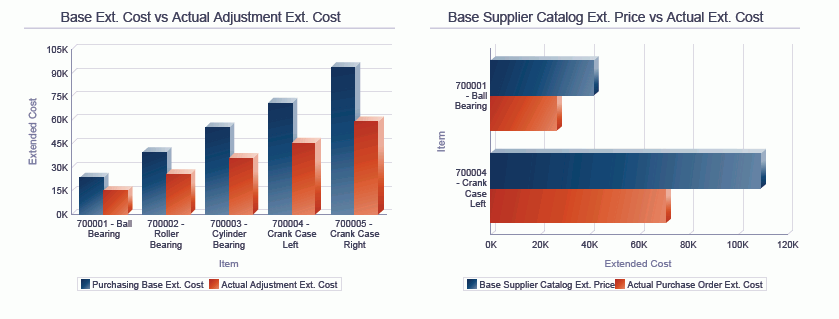
Base Extended Cost vs. Actual Adjustment Extended Cost by Item (bar graph)
Base Supplier Catalog Extended Price vs. Actual Extended Cost by Item (horizontal bar graph)
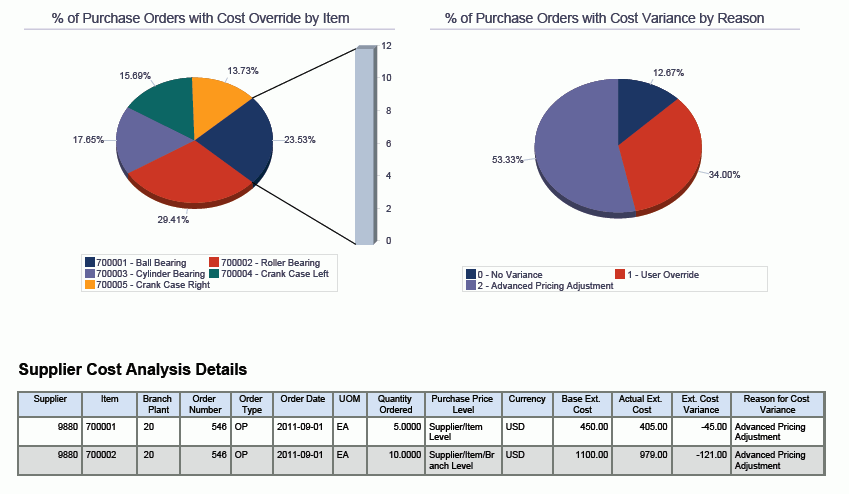
Percentage of Purchase Orders with Cost Override by Item (pie chart)
Percentage of Purchase Orders with Cost Variance by Reason (pie chart)
Supplier Cost Analysis Details (table)
The Supplier Cost Analysis Details table component contains drill back functionality as described in the following table:
Functionality |
Value |
|---|---|
Table column containing drill back link |
Order Number |
Table columns passed to application |
Branch Plant, Order Type |
Application called |
Purchase Orders (P4310) |
Form called |
W4310I |
Version called |
ZJDE0001 |