Warehouse Suggestion Productivity Analysis
The Warehouse Suggestion Productivity Analysis report enables you to view warehouse suggestion information for a specified day.
Green: Results are within the established target.
Yellow: Results are over the established target, but within a tolerance interval. They should be analyzed and monitored.
Red: Results are far above the established target and require urgent attention or immediate action.
This report contains the following components:
Component |
Description |
|---|---|
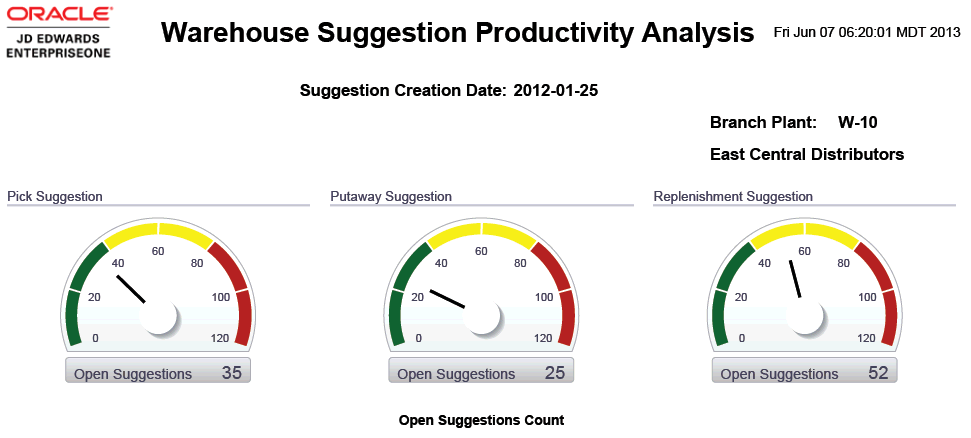
Open Pick Suggestions (gauge) |
This gauge enables you to quickly estimate the number of open pick suggestions for the selected day. The gauge displays three color-coded categorical ranges:
|
Open Putaway Suggestions (gauge) |
This gauge enables you to quickly estimate the number of open putaway suggestions for the selected day. The gauge displays three color-coded categorical ranges:
|
Open Replenishment Suggestions (gauge) |
This gauge enables you to quickly estimate the number of open replenishment suggestions for the selected day. The gauge displays three color-coded categorical ranges:
|
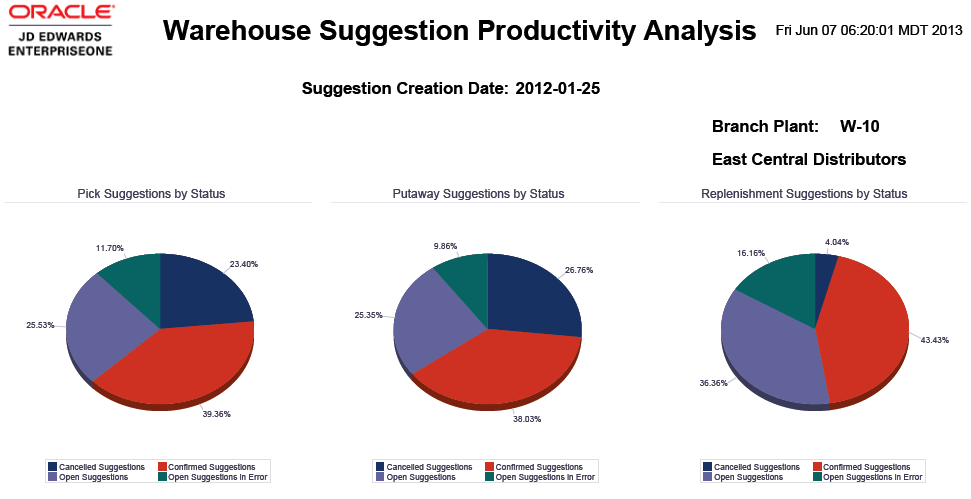
Pick Suggestions by Status (pie chart) |
This pie chart enables you to view the total number of pick suggestions for the selected day. The total count reflects pick suggestions that are open, confirmed, and cancelled. |
Putaway Suggestions by Status (pie chart) |
This pie chart enables you to view the total number of putaway suggestions for the selected day. The total count reflects pick suggestions that are open, confirmed, and cancelled. |
Replenishment Suggestions by Status (pie chart) |
This pie chart enables you to view the total number of replenishment suggestions for the selected day. The total count reflects pick suggestions that are open, confirmed, and cancelled. |
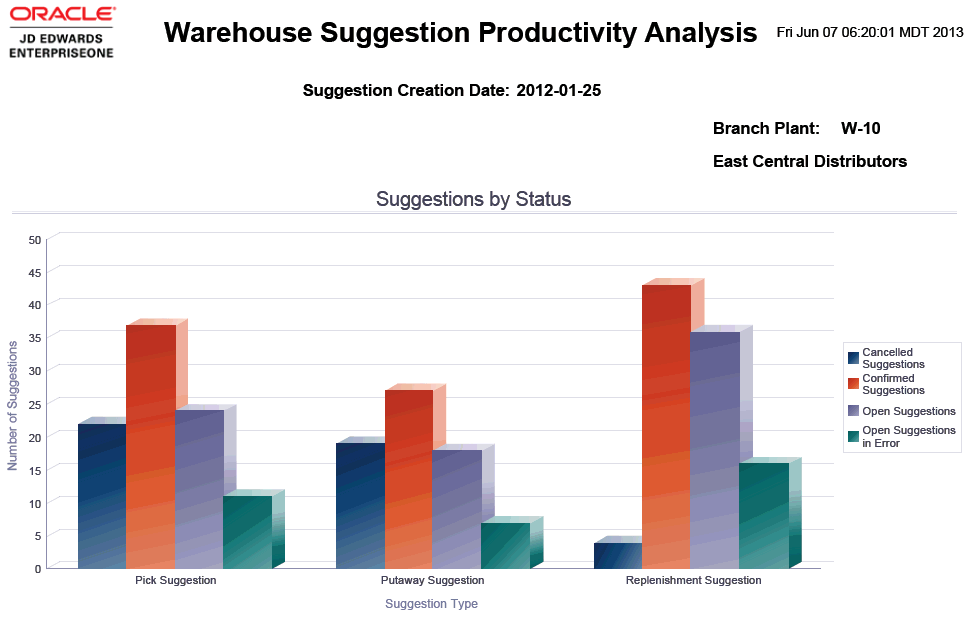
Suggestions by Status (bar chart) |
This bar chart enables you to compare pick, putaway, and replenishment suggestions for the selected day based on status. The statuses are divided into four categories:
|
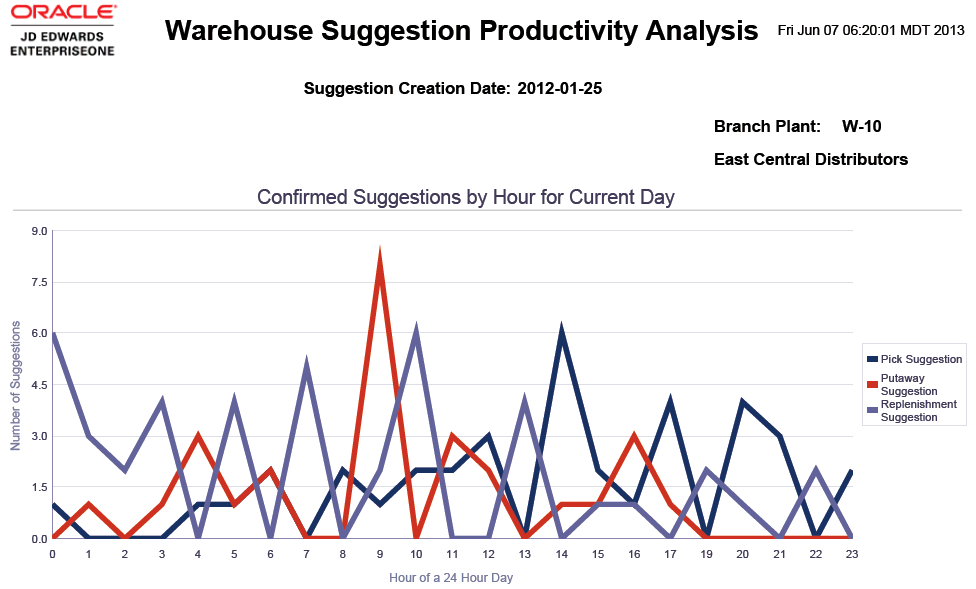
Confirmed Suggestions by Hour for Current Day (line chart) |
This line graph enables you to view the number of confirmed warehouse suggestions each hour for the selected day. |
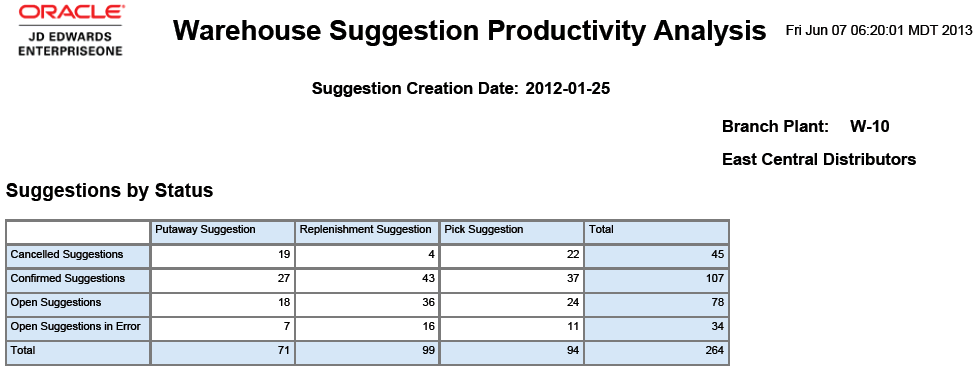
Suggestions by Status (table) |
This table displays a historical summary of total picking, putaway, and replenishment suggestions categorized by status. The respective suggestions are categorized by four statuses: open suggestions, cancelled suggestions, confirmed suggestions, and open suggestions in error. The system uses this information in the graphs for the selected branch/plant. |
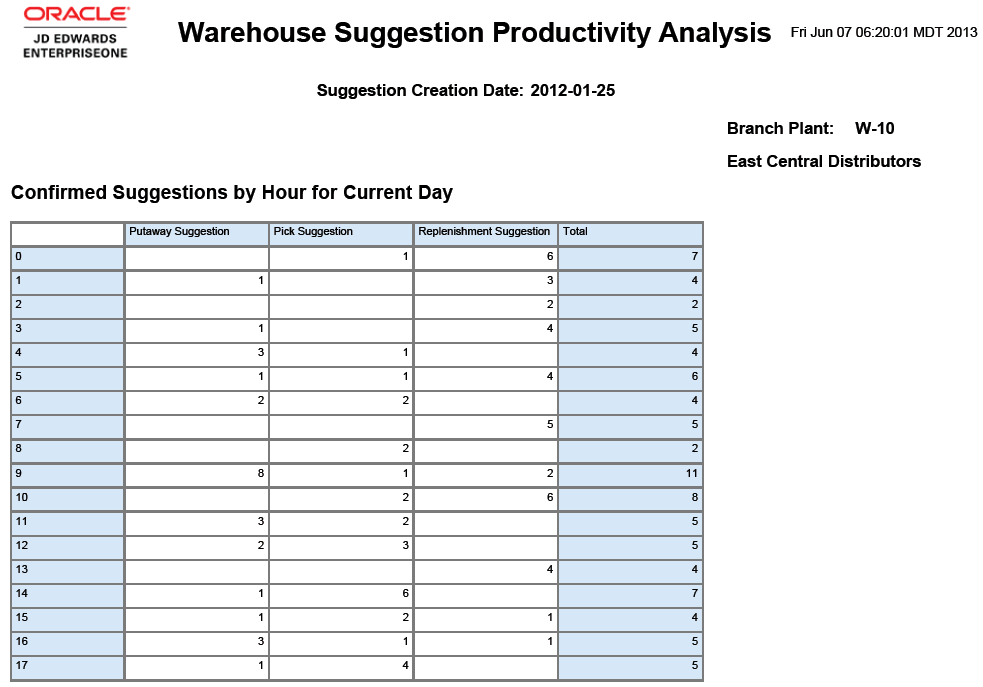
Confirmed Suggestions by Hour for Current Day (table) |
This table displays a historical summary of total picking, putaway, and replenishment suggestions that are confirmed each hour of the selected day. The system uses this information in graphs for the selected branch/plant. |
Warehouse Suggestion Productivity Details Table |
This table displays all of the historical detail records for picking, putaway, and replenishment suggestions. This information includes statuses, batch numbers, sequence numbers, and the hour the suggestion is confirmed. The system uses this information to create the graphs and charts for the selected branch/plant. |
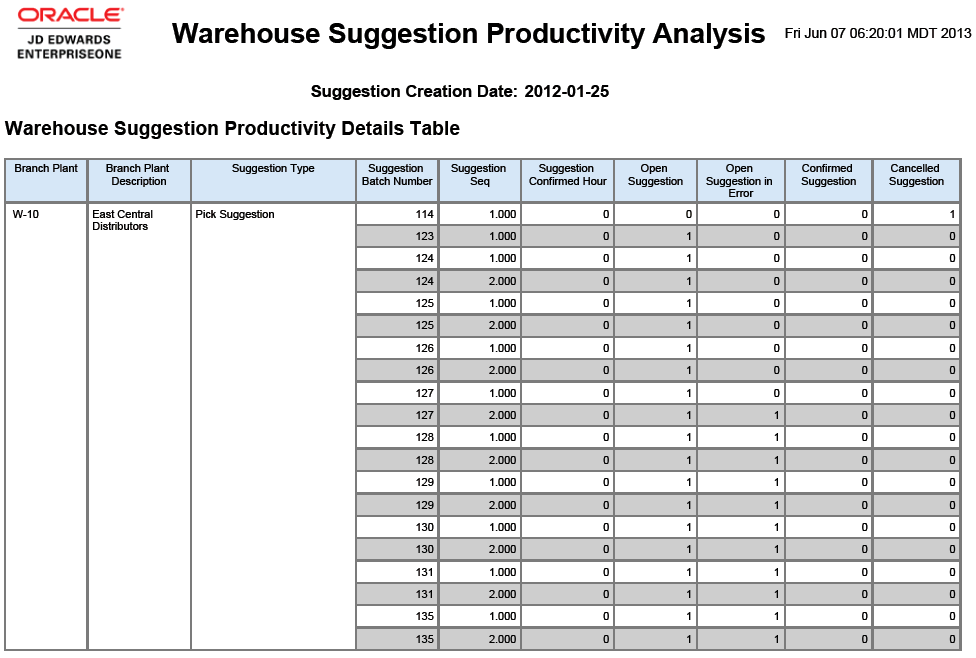
The system indicates that the suggestion is open, confirmed, or cancelled by inserting 1 in the respective column fields.
The system inserts 0 to indicate that the suggestions are not open, confirmed, or cancelled in accordance with the status criteria.
Suggestion |
Status |
|---|---|
Open Suggestion |
300 and 340 |
Open Suggestion in Error |
300 and 340 |
Confirmed Suggestion |
399 |
Cancelled Suggestion |
391 |