Warehouse Utilization Analysis
The Warehouse Utilization Analysis report enables you to view areas within the warehouse to determine location volume usage with zones and aisles. This report contains the following components:
Component |
Description |
|---|---|
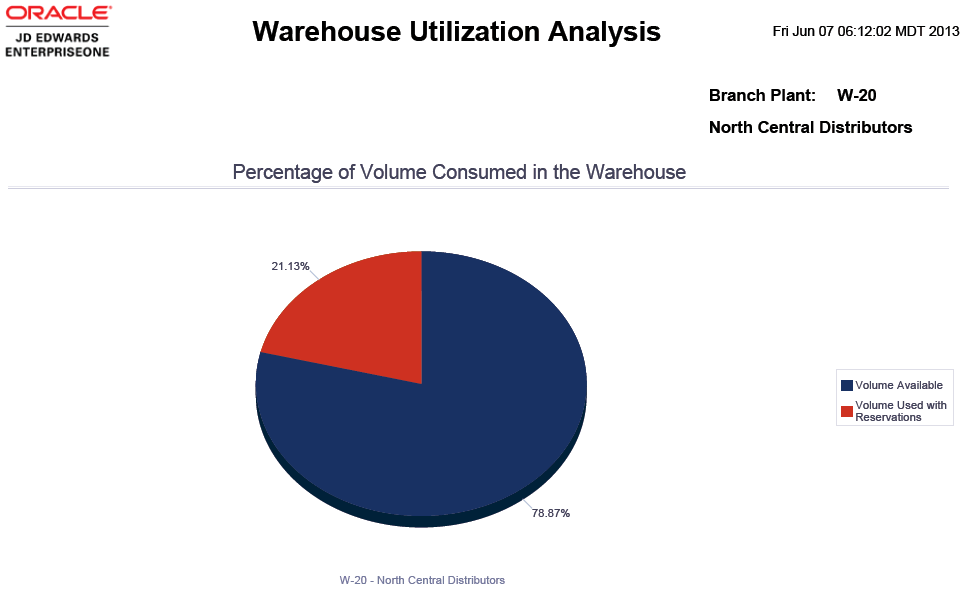
Percent of Volume Consumed in the Warehouse (pie chart) |
This pie chart enables you to view the combined total of the available volume in the warehouse plus the used volume in the warehouse. The used volume includes reservations. |
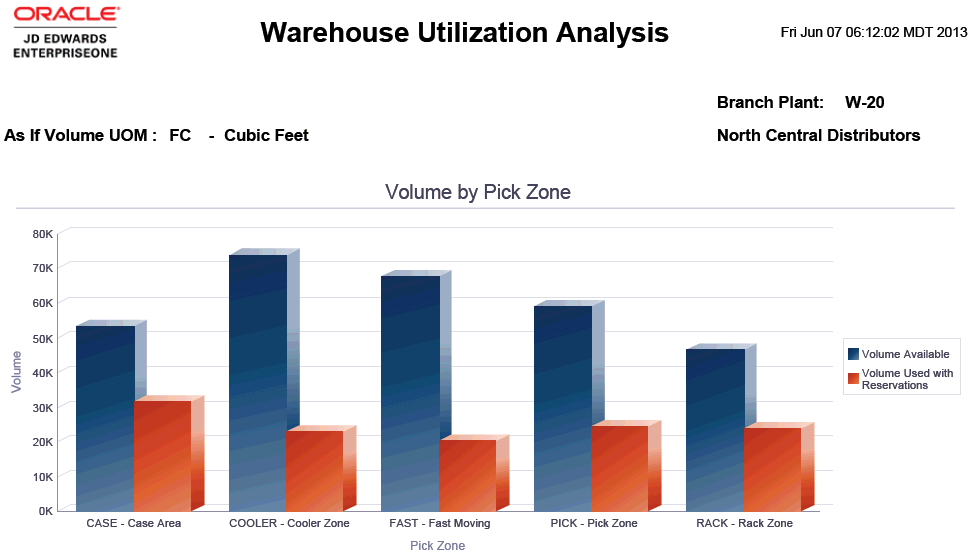
Volume by Pick Zone (bar chart) |
This bar chart enables you to review and compare the available and used volume in each of the respective picking zones in your warehouse. |
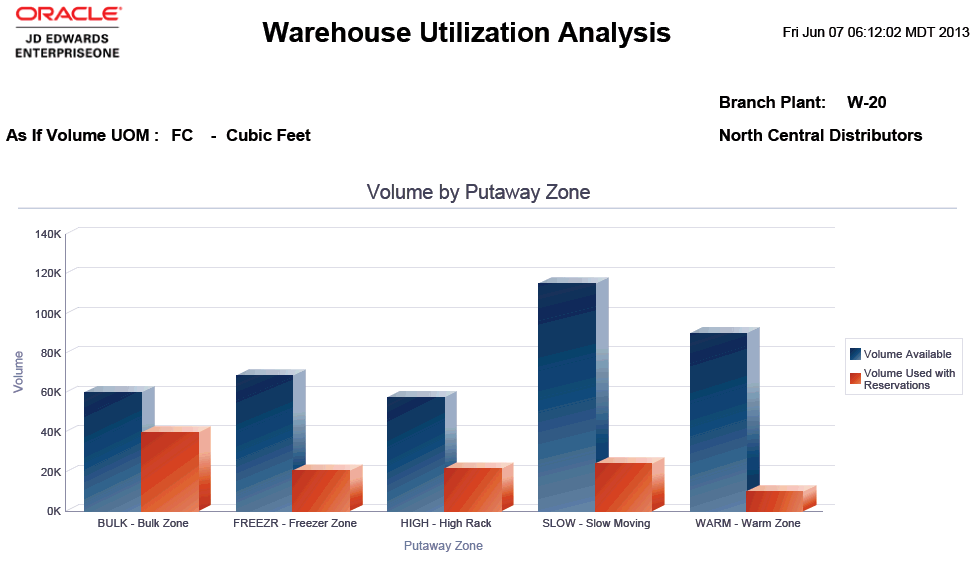
Volume by Putaway Zone (bar chart) |
This bar chart enables you to review and compare the available and used volume in each of the respective putaway zones in your warehouse. |
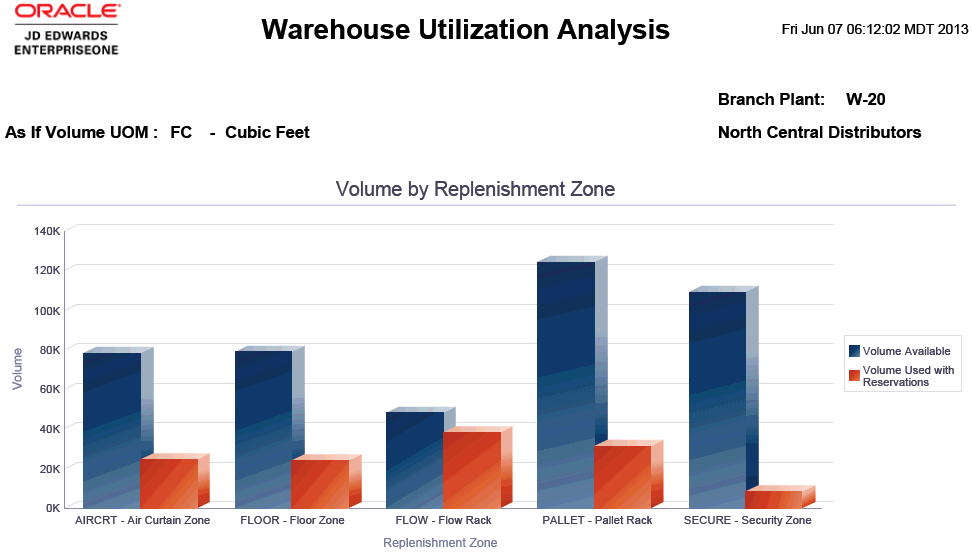
Volume by Replenishment Zone (bar chart) |
This bar chart enables you to review and compare the available and used volume in each of the respective replenishment zones in your warehouse. |
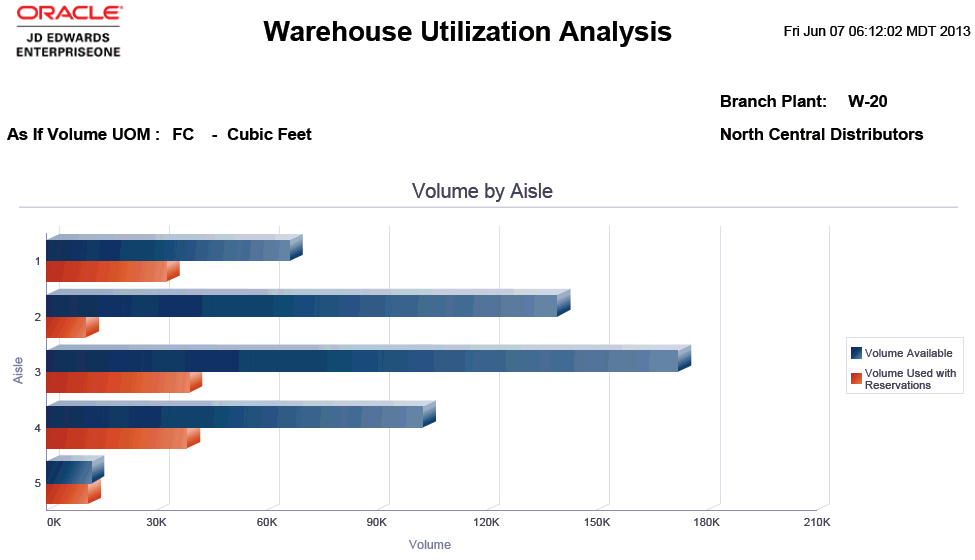
Volume by Aisle (bar chart) |
This bar chart enables you to review and compare the available and used volume in each of the respective aisles in your warehouse. |
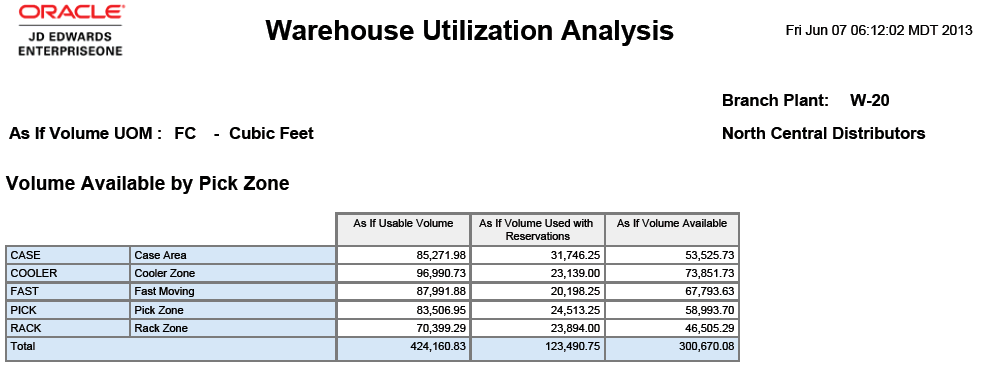
Volume Available by Pick Zone (table) |
This table displays a historical summary of total volume available in the selected UOM in the picking zones of the warehouse. This information is categorized by the total as if usable volume, as if volume used with reservations, and as if volume available. The system uses this information in graphs for the selected branch/plant. |
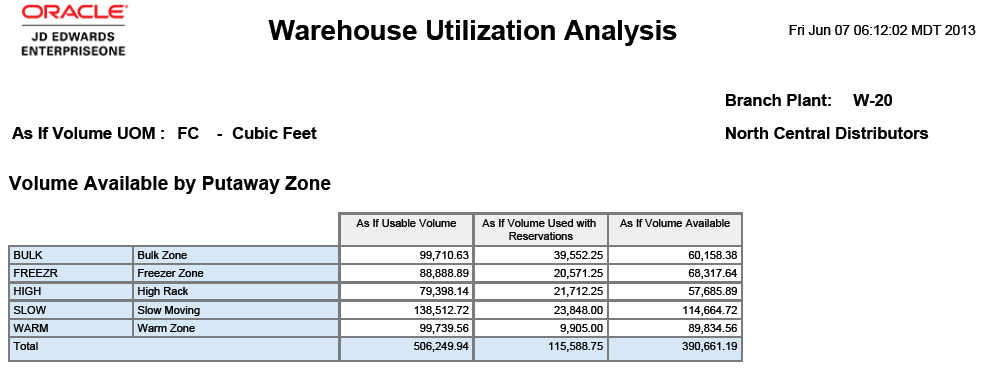
Volume Available by Putaway Zone (table) |
This table displays a historical summary of total volume available in the selected UOM in the putaway zones of the warehouse. This information is categorized by the total as if usable volume, as if volume used with reservations, and as if volume available. The system uses this information in graphs for the selected branch/plant. |
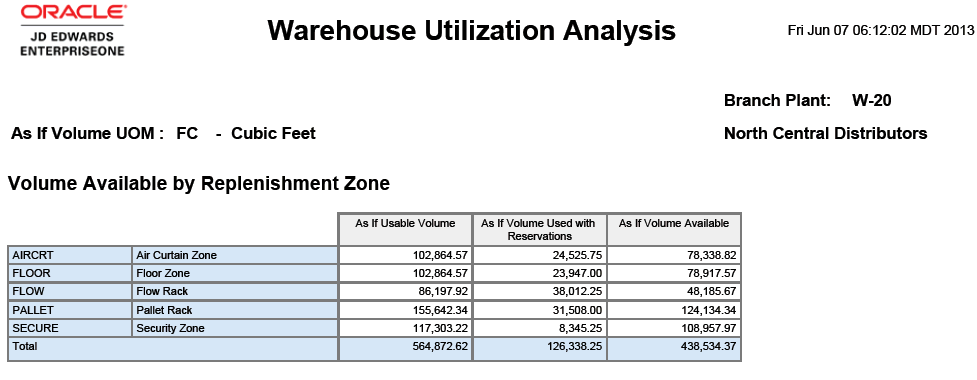
Volume Available by Replenishment Zone (table) |
This table displays a historical summary of total volume available in the selected UOM in the replenishment zones of the warehouse. This information is categorized by the total as if usable volume, as if volume used with reservations, and as if volume available. The system uses this information in graphs for the selected branch/plant. |
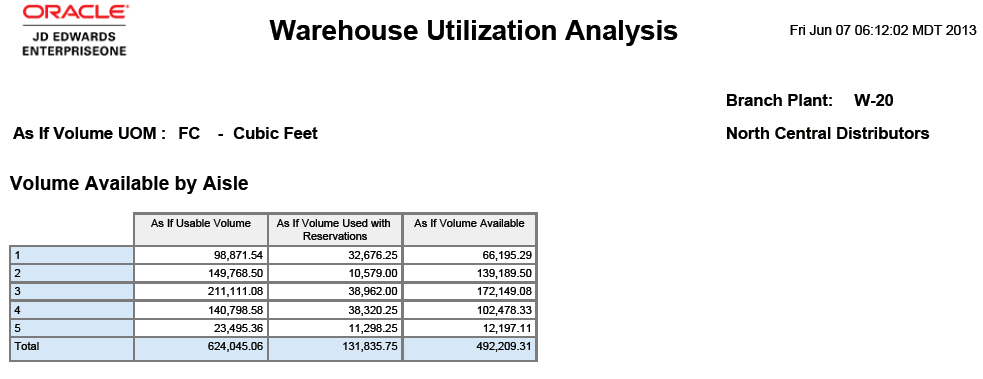
Volume Available by Aisle (table) |
This table displays a historical summary of total volume available in the selected UOM in the aisles of the warehouse. This information is categorized by the total as if usable volume, as if volume used with reservations, and as if volume available. The system uses this information in graphs for the selected branch/plant. |
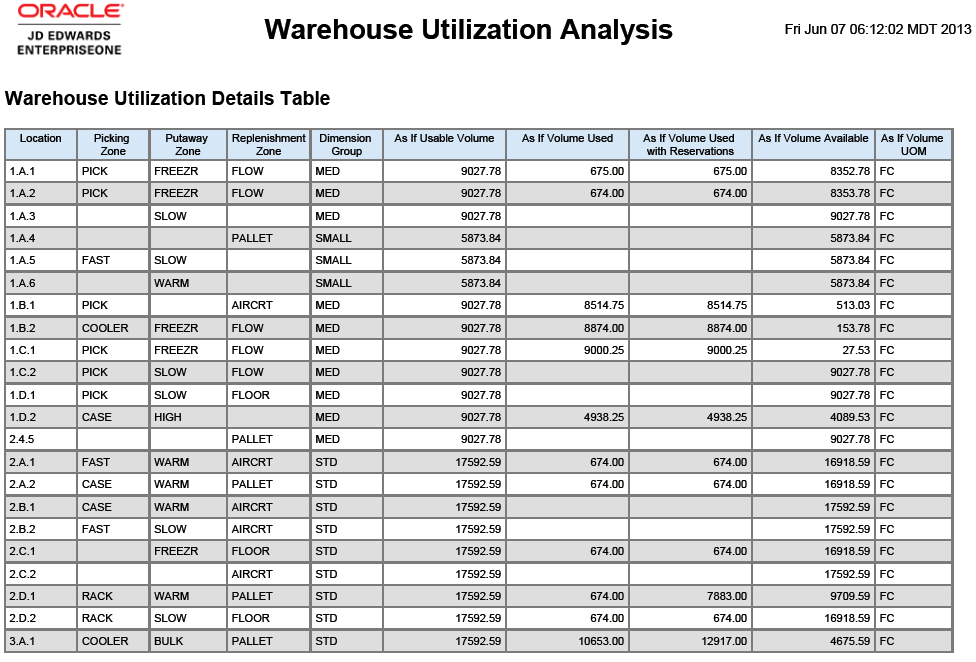
Warehouse Utilization Details Table |
This table displays all of the historical detail records for picking, putaway, and replenishment zones; and dimension groups. This information includes locations, volume usage and availability; and unit of measure. The system uses this information to create the graphs and charts for the selected branch/plant. |
