Work Order Metrics Analysis
This report provides some key metrics from the other reports. The following metrics are graphically presented by Business Unit: Average Work Order Age in Days, Work Order Type, Incoming, Planned and Completed Work Order Rates, Average Days to Complete, and Estimated vs. Actual Total Costs and Cost Variance. At the end of the report individual work order metrics are presented in tabular form by Business Unit, Supervisor, and Lead Craft.
This report contains the following components:
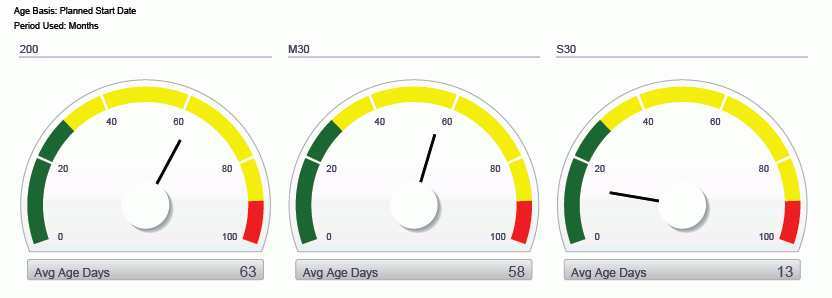
Average Age by Business Unit (gauges)
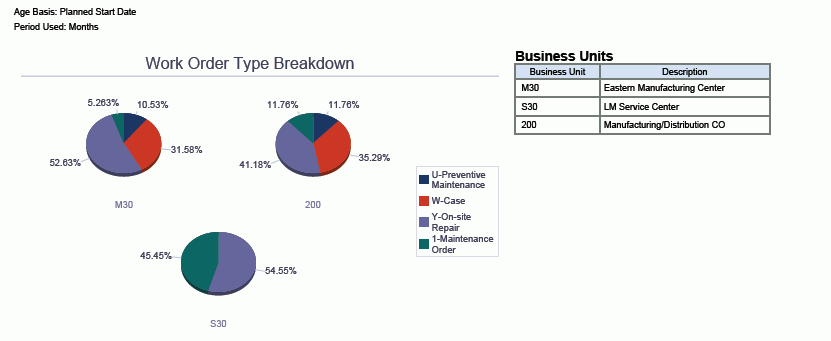
Work Order Type Breakdown by Business Unit (pie charts)
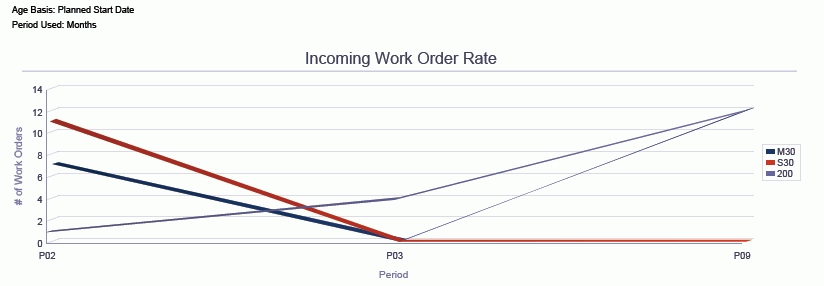
Incoming Work Order Rate (line graph)
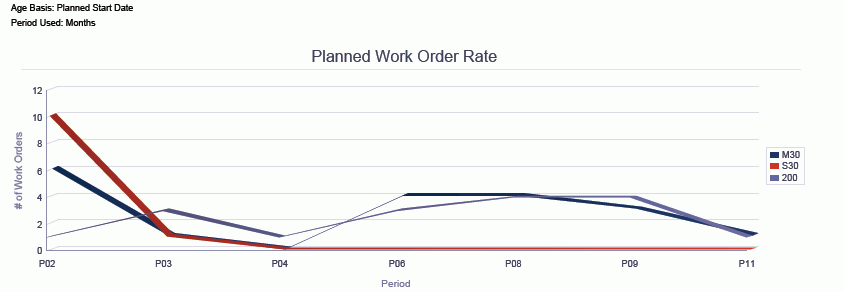
Planned Work Order Rate (line graph)
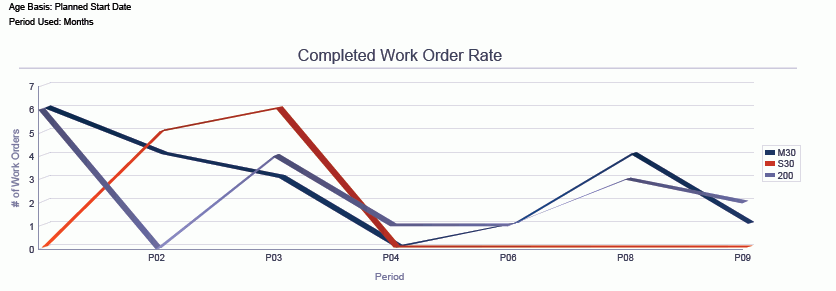
Completed Work Order Rate (line graph)
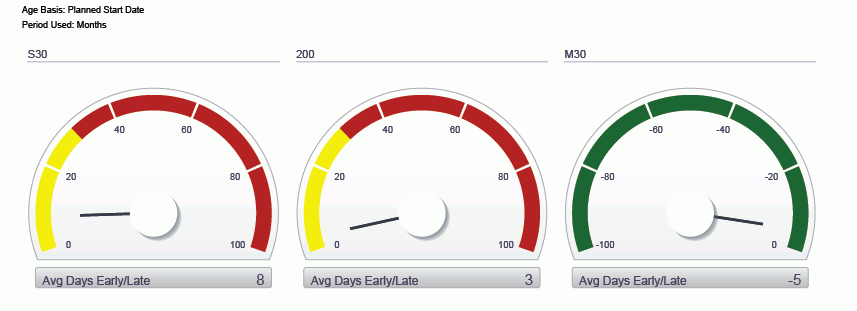
Work Order Days Complete by Business Unit (gauges)
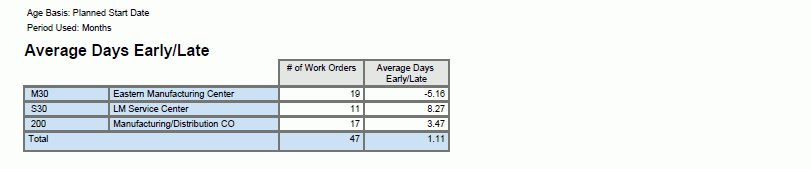
Average Days to Complete Work Orders (table)
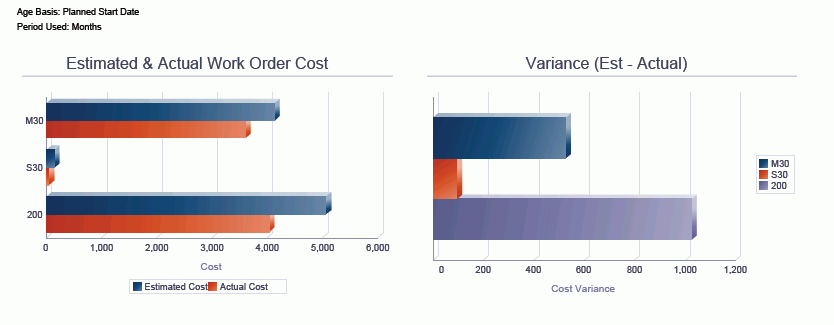
Estimated and Actual Work Order Cost (horizontal bar graph)
Variance (Estimated - Actual) (horizontal bar graph)
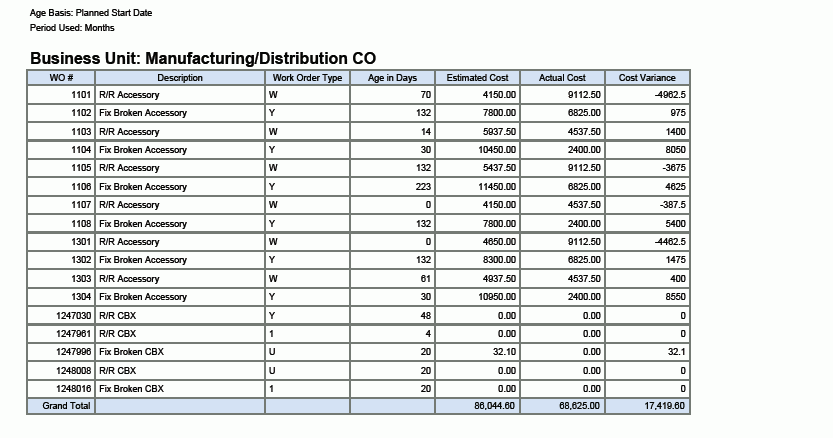
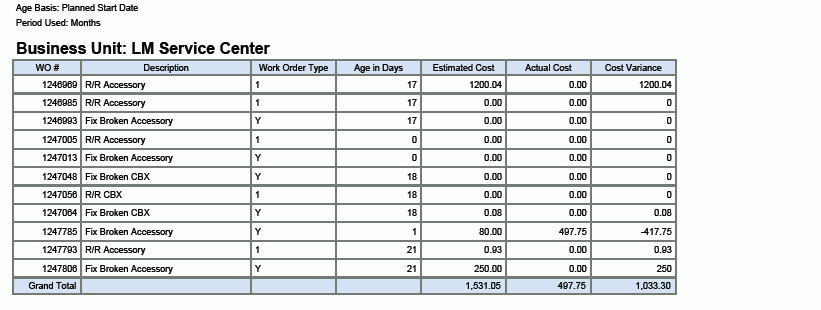
Work Orders by Business Unit (multiple tables)
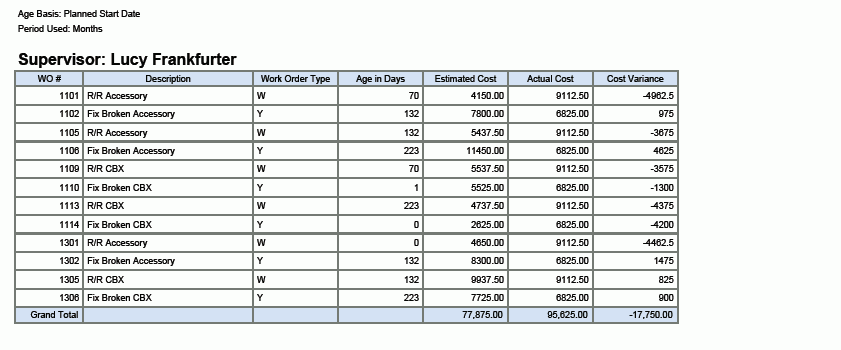
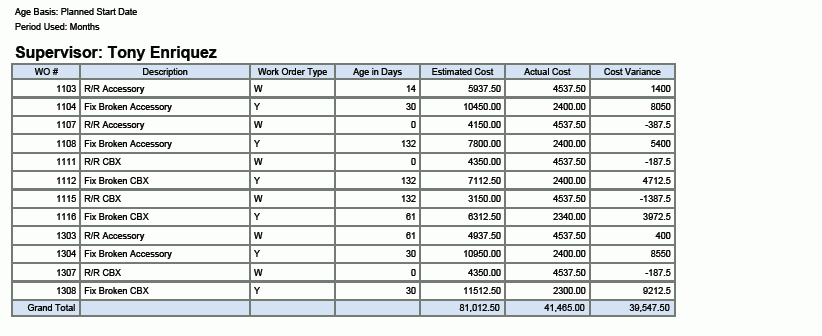
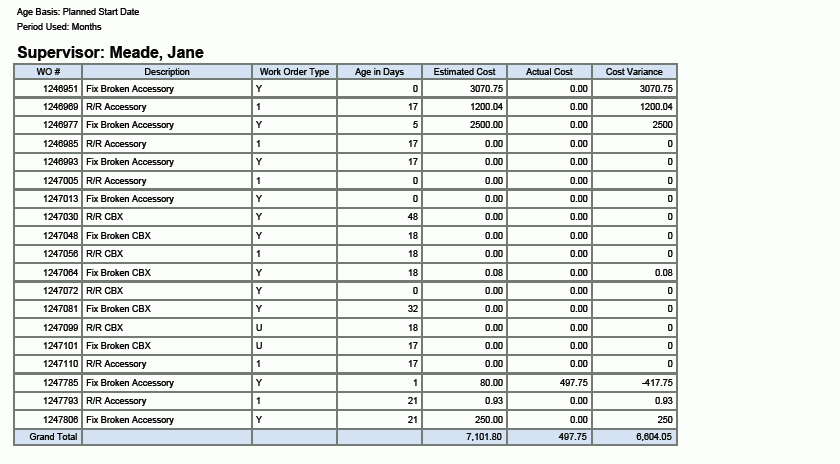
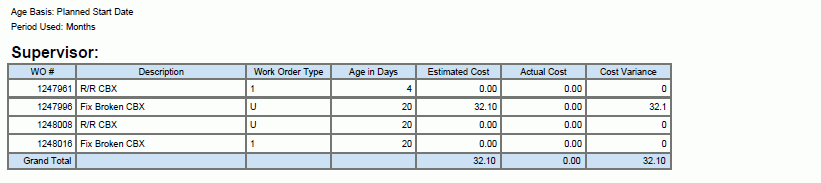
Work Orders by Supervisor (multiple tables)
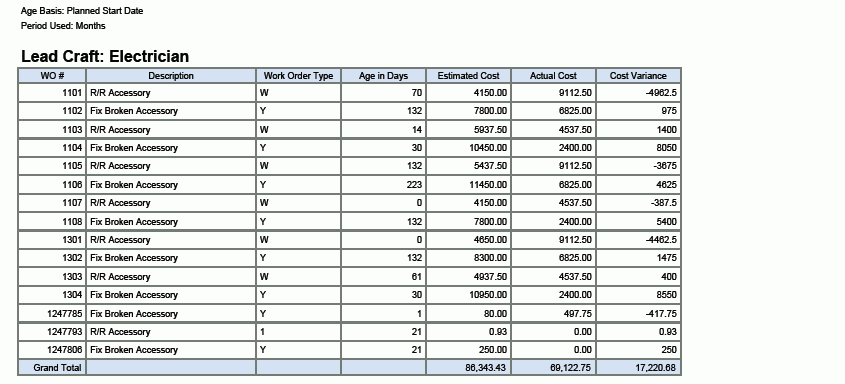
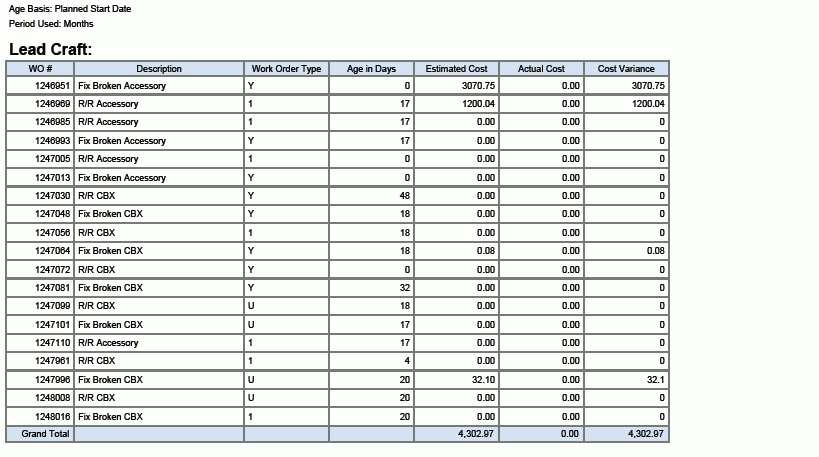
Work Orders by Lead Craft (multiple tables)
This report contains drill back functionality as described in the following table:
Functionality |
Value |
|---|---|
Table column containing drill back link |
Work Order Number |
Table columns passed to application |
WO Number |
Application called |
Work Order Revisions (P17714) |
Form called |
W17714A |
Version called |
ZJDE0003 |
The following report was generated by using this criteria:
Work Order Type = Service Work Order (processing option)
Work Order Age Basis = Planned Start Date (processing option)
Show Only Work Orders with Open Commitments check box was not selected.
Period Type to Analyze = months
Business Units = M30 (Eastern Manufacturing Center), S30 (LM Service Center), and 200 (Manufacturing/Distribution Co)