Example 1
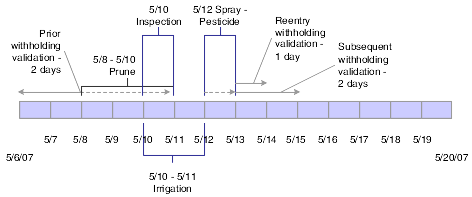
This table and the subsequent timeline demonstrate the interdependencies of several operations that use withholding codes:
Operation Name |
Oper Duration/ Days |
Oper Start Date |
Oper End Date |
W/H Type Code |
Validation Check Box |
W/H Days |
W/H Period Start Date |
W/H Period End Date |
|---|---|---|---|---|---|---|---|---|
Prune |
3 |
May 8 |
May 10 |
P |
2 |
May 6 |
May 10 |
Operation Name |
Oper Duration/ Days |
Oper Start Date |
Oper End Date |
W/H Type Code |
Validation Check Box |
W/H Days |
W/H Period Start Date |
W/H Period End Date |
|---|---|---|---|---|---|---|---|---|
Spray - Pesticide |
1 |
May 12 |
May 12 |
R |
Checked |
1 |
May 12 |
May 13 |
S |
2 |
May 12 |
May 14 |
Operation Name |
Oper Duration/ Days |
Oper Start Date |
Oper End Date |
W/H Type Code |
Validation Check Box |
W/H Days |
W/H Period Start Date |
W/H Period End Date |
|---|---|---|---|---|---|---|---|---|
Irrigation |
2 |
May 10 |
May 11 |
Operation Name |
Oper Duration/ Days |
Oper Start Date |
Oper End Date |
W/H Type Code |
Validation Check Box |
W/H Days |
W/H Period Start Date |
W/H Period End Date |
|---|---|---|---|---|---|---|---|---|
Inspection |
1 |
May 10 |
May 10 |
R |
Checked |
This diagram is a graphical representation of the four operations in the table. The dotted lines represent the operation start and end dates for the prune and pesticide operations. The solid lines, for these two operations, represent the withholding periods.
