The Supply and Demand Chart (Release 9.2 Update)
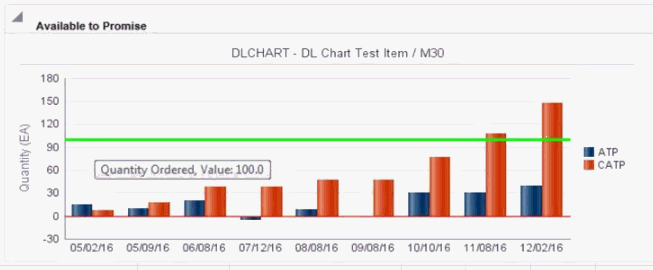
A chart has been added to the Work With Supply and Demand form that enables users to view, at a glance, the ATP and CATP amounts. You can hover over the items in the chart to view the actual amounts.
Additionally, if you access this form directly from a sales order, the system adds a green line to the chart to show the order quantity. You can use the chart to determine when you will have enough supply to meet the demand of the current order. If you click on a bar that has a value greater than or equal to the ordered quantity, the supply date is returned to the Promised Ship Date field on the sales order.
Note that, regardless of processing option settings, the chart does not include planned orders or forecasted amounts.
