Time Fences and the Time Series
Planning horizons are divided into time frames that establish operation policies or guidelines for prioritizing activities.
The time fences define how priority decisions are made with respect to scheduling supply to meet demand. Time fences denote where defined planning rules are applied in balancing the supply to meet existing demand. Time fences apply to sources of demand that are used to plan calculations. Time fence rules stipulate how forecast, customer demand, or a mixture of these are used during the netting calculations when you are establishing the schedule.
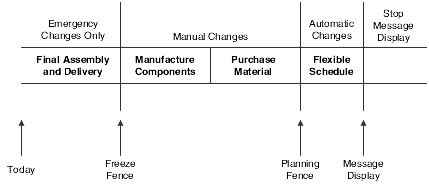
Time fences are points in time when you can make changes to either policy or operating procedures. JD Edwards EnterpriseOne software includes three fences:
Freeze
Planning
Message Display
This table describes each planning fence and its function:
Fence Type
Function
Freeze Fence (F)
The number of days from the generation start date during which the system should not create or replan order messages. For example, if the generation start date is January 3, and the freeze time fence is three days, the planning system does not display messages with dates that are prior to or equal to January 6.
Imbalances of supply and demand within the freeze fence are planned outside the freeze fence.
Planning Fence (P)
The number of days that the system uses with the time fence rule to determine how demand is used. Enter the number of days after the generation start date when the time fence rule changes from the first rule to the second rule. For example, if the time fence rule is S (customer demand before the time fence, forecast after the time fence), the generation start date is January 3, and the planning time fence is three days, then the system plans according to customer demand through January 6. Beginning on January 7, the system plans according to the forecast.
Message Display Fence (D)
The number of days after the generation start date during which the system should display messages. For example, if the generation start date is January 1, the shop calendar is seven days a week, and the message fence is 30 days, the system displays messages with dates before or equal to January 31. The system does not display messages with start dates of February 1 or later. However, the planning horizon for orders continues past this date and is reflected in available-to-promise totals.
Time fences are a critical input to the master schedule. The time series is the primary output of the master schedule.
The diagram is an example of a time series:

In the Item Master program (P4101), you specify on the Manufacturing Data tab of the Additional System Information form the number of days after the generation start date to be included in each time fence period. For time fences:
The system does not count the generation start date; that is, the day after the generation start date is day 1.
For manufactured items, the system counts working days as defined in the Shop Floor Calendar.
For purchased items, the system counts calendar days.
Each of the fences is displayed on the time series in its respective bucket. Along with the codes F, P, and D, you will also see Level Lead time (L), Manufacturing Lead time (M), and Cumulative Lead time (C).
You can also generate a master schedule for items by using forecast consumption planning rule H. Forecast consumption occurs when forecasted demand is reduced by actual sales orders that are received or shipped, up to the forecasted quantity. By consuming the forecast, you can revise the production schedules to reflect the most up-to-date information.