Preview
You can use the Preview tab (preview mode) in the Enterprise Process Manager window to preview the Enterprise Process view with the current runtime metrics defined in the template. The system displays the purchase order template preview in the model pane and the Process Analytics tab on the right.
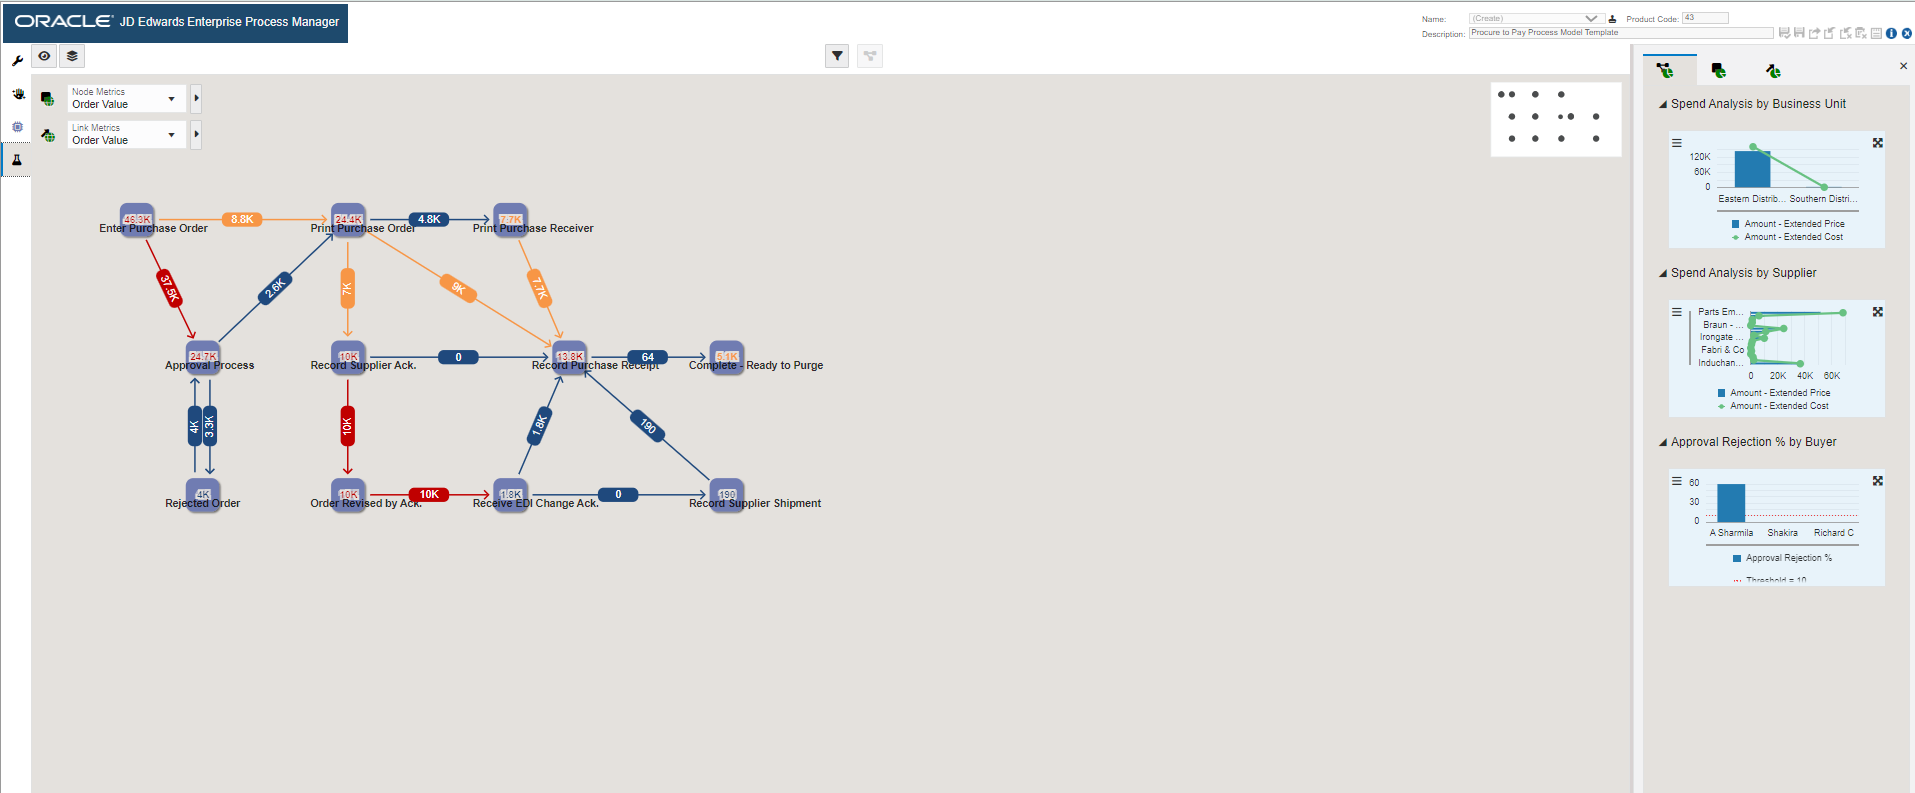
In the preview mode, you can adjust the position of the nodes, change the default filters, modify the display options, configure the metrics thresholds, set up chart configurations within the analytic panes, use the snap to node and grid, and zoom to fit options. All these changes can be saved in the preview mode.
To preview the runtime metrics of the Procure to Pay process model:
- In the Enterprise Process Manager window, click the Preview tab. The
Process Analytics tab is displayed on the right. This tab displays the
analytics charts for the Procure to Pay process model.
You can view the Spend Analysis by Business Unit, Spend Analysis by Supplier and Approval Rejection % by Buyer charts in the Process Metrics tab. These charts are generated based on the grouping selection in the context Analytic section in design time.
-
The Amount - Open, Units - Open, and Amount Extended Price options are listed in the Node metrics drop-down based on the columns selected to return value (for node metrics) in the Enterprise Process Manager window (design time). Order Line Count is also listed in the drop-down because Include Count under Return Fields is enabled in design time.
For more information, See "Understanding Color Codes" in the JD Edwards EnterpriseOne Tools Enterprise Process Modeler Guide.
-
To preview the node metrics details:
-
In the Procure to Pay process model, the Order Value is selected in the Node Metrics drop-down list. The value is displayed in red, since it exceeds the threshold value.
- Click the node to view the node-specific analytics in the Node Analytics tab
on the right. In the Node Analytics tab, you can view the Supplier-wise
Split at Selected Node, Company-wise Split at Selected Node,
and Business Unit-wise Split at Selected Node. These charts are
generated based on the grouping selection in the context Analytic section in
design time. Note: You can click the Click to set the context to the process level icon to view the Process Analytics tab.
To preview the link metrics details:
-
In the Link Analytics tab, you can view the Supplier-wise Split at Selected Link, Company-wise Split at Selected Link, and Business Unit-wise Split at Selected Link.
Note: You can click the Click to set the context to the process level icon to view the Process Analytics tab.
-
- Click the Analytics Options icon . Select the values from the View By
drop-down list. The values displayed in this drop-down list are Overview,
Order Date, Order Company Number, and Business Unit. These
values are displayed because the grouping for them is allowed in the design time. If
you select an option other than Overview, either a Timeline view or a Domain view is
displayed.
You can make changes to the node and link metrics in the Timeline and Domain views. The system displays the corresponding changes in the Analytics tab on the right.
- Click Save. Enter a new name for the Enterprise process. The system saves the
enterprise process as a UDO. Note: Enterprise Processes are saved and managed as UDOs in EnterpriseOne. The Enterprise Process Manager includes UDO options on the tool bar that enable you to create enterprise processes for your personal use, publish or share them, and modify shared enterprise processes that are created by other users. For more information, See "User Defined Object (UDO) Features in Enterprise Process Manager".
To access the shared Enterprise process UDO, select it from the user drop-down list. Ensure that the Enterprise process is saved as a UDO and is shared with you.