Process Metrics
The Process Metrics tab displays details such as Filter Criteria, Return Fields, Context Analytic, and so on for the related tables and business views of the selected enterprise process template. The Process Metrics is used to analyze and measure the overall performance of the process.
Click the Process Metrics icon. For the Receipt Routing process model, you can review the settings in the read-only mode for these process metrics:
- Movement Code
- Reason Code
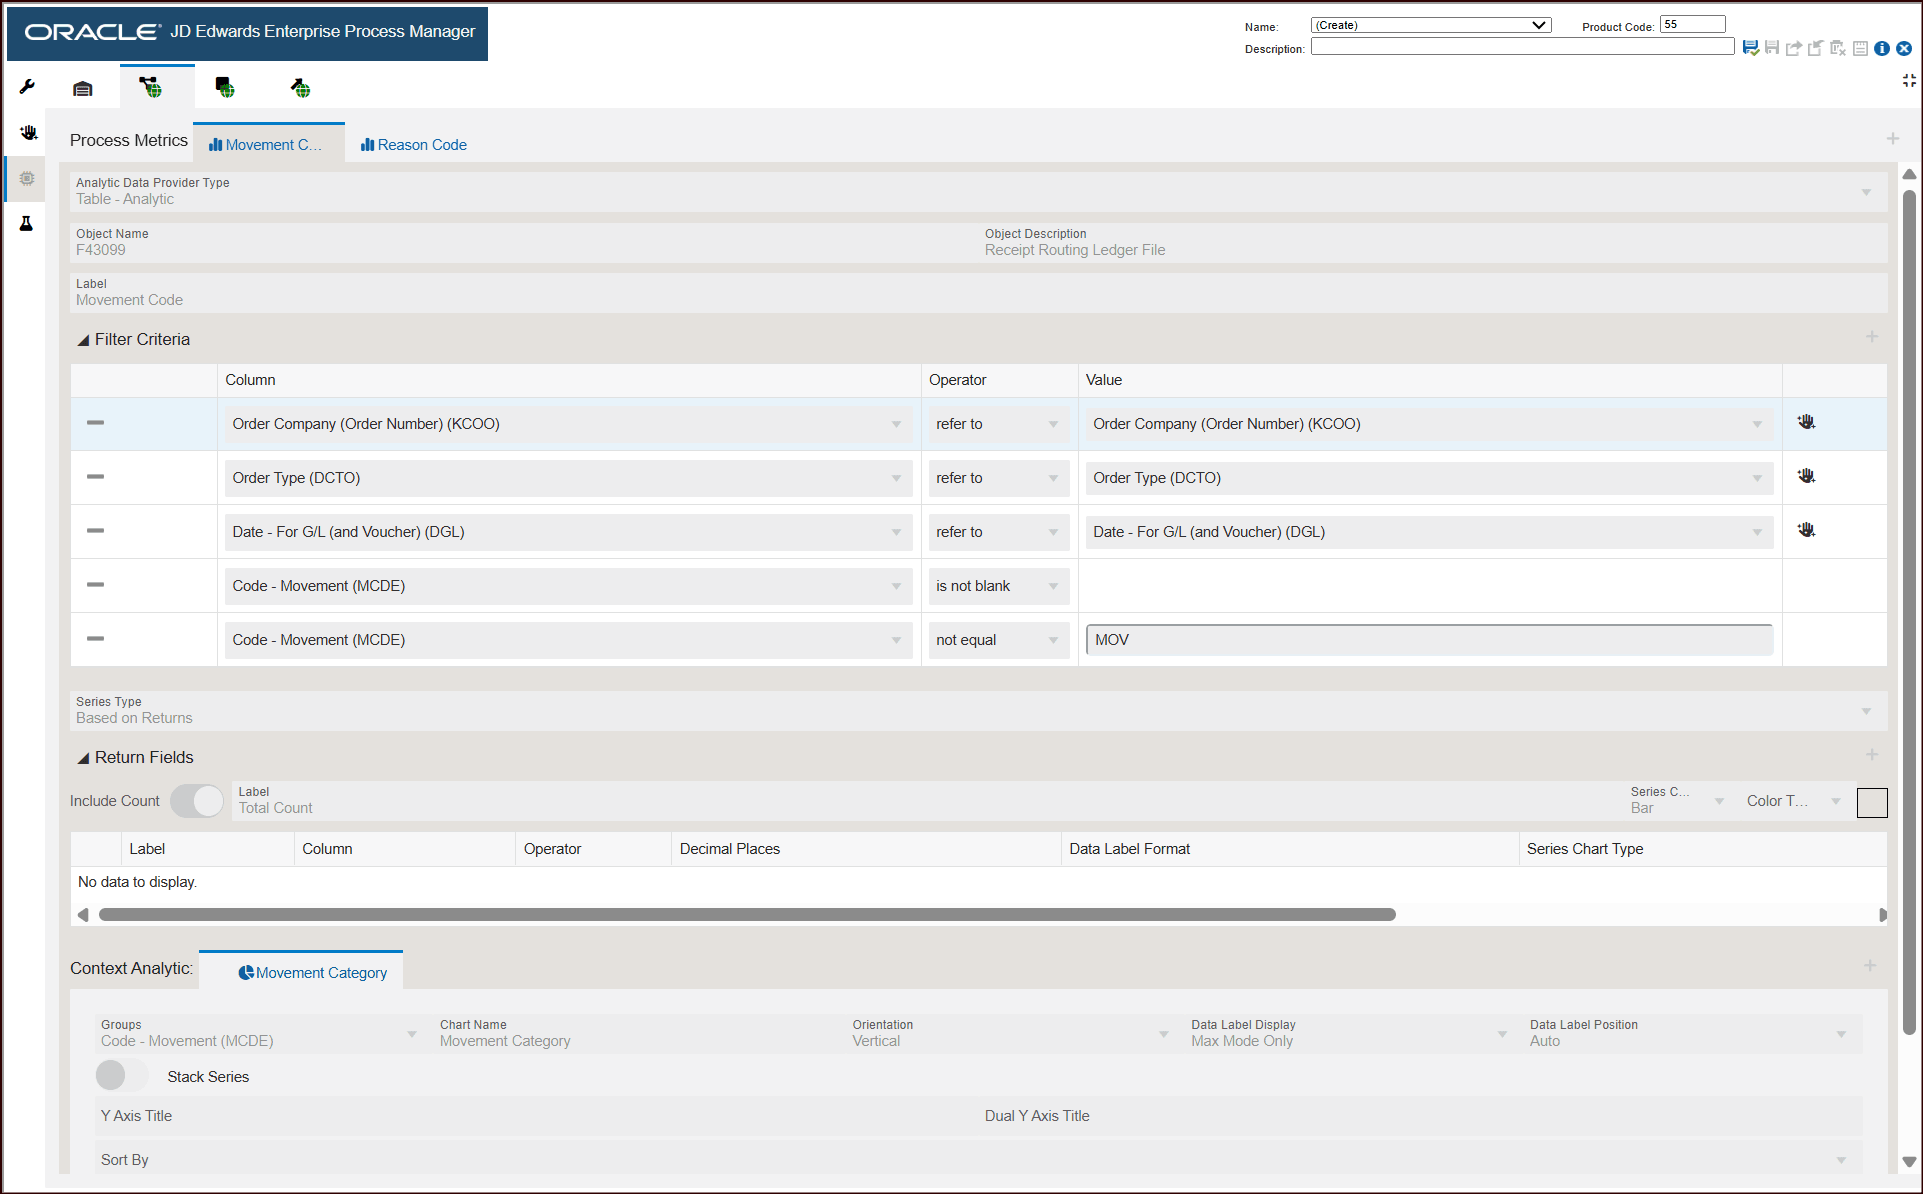
For the Movement Code process metrics displays the following information:
- Object type: Table - Analytic
- Object Name: F43099
- Object Description: Receipt Routing Ledger File
- The Filter Criteria displays the list of columns that are considered for filtering and the value each column is referring to. These filter options are displayed when you click the Show Filter Options icon to analyze the enterprise process. For more information, see "Using the Show Filter Options".
- The Series Type selected is Based on Returns. This criteria returns standard aggregated values from View to display the values on charts in preview mode.
- The system uses the data in Context Analytic section to generate charts. For every row in this section, a unique chart is generated.
Charts
Based on the details in the Context Analytic section, the data is grouped in the Process Metrics tab. For Movement Code metrics, the Movement Category chart is generated.
This table lists and describes the charts that are available on the Process Metrics tab for Movement Code:
|
Component Title |
Description |
|---|---|
|
Movement Category |
Use this chart to view the count of movements categorized by code or category. The chart depicts the count by category vertically. |
Click the Reason Code tab. The process metrics displays the following information:
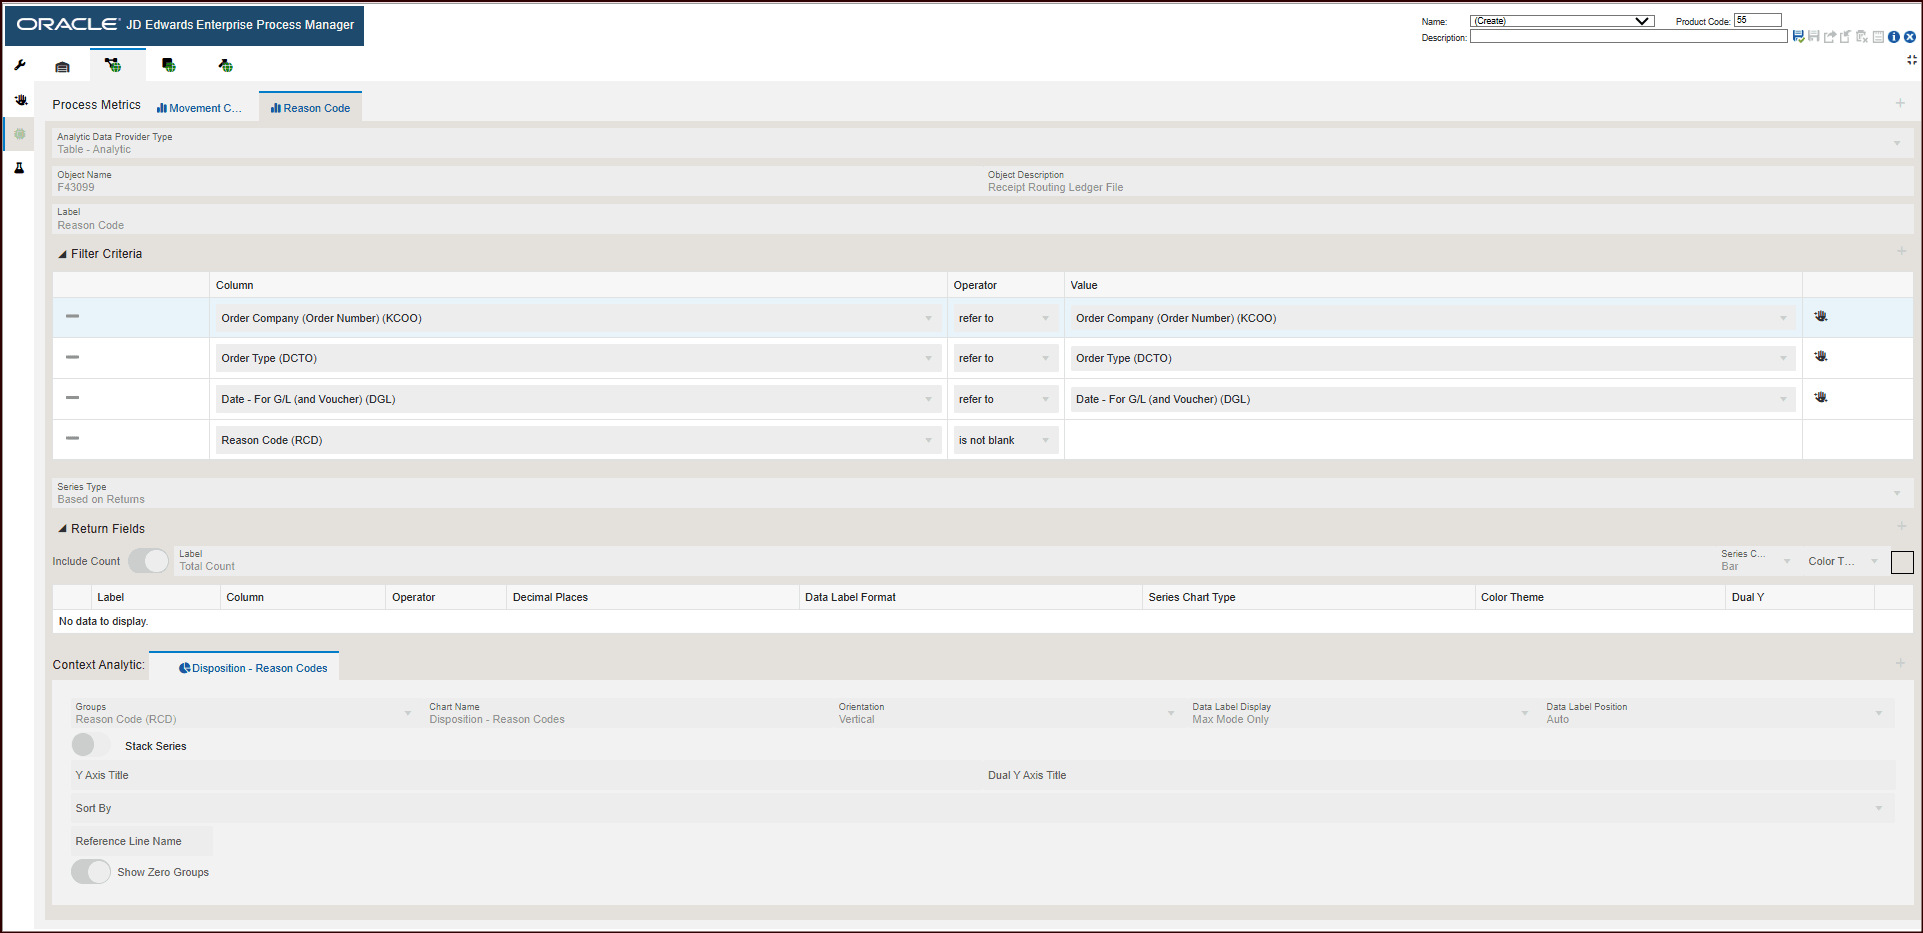
- Object type: Table - Analytic
- Object Name: F43099
- Object Description: Receipt Routing Ledger File
- The Filter Criteria displays the list of columns that are considered for filtering and the value each column is referring to.
- The Series Type selected is Based on Returns.
- The system uses the data in Context Analytic section to generate charts. For
every row in this section, a unique chart is generated.
Charts
For the cost deviation metrics, the Disposition is grouped by Reason and is represented in the Disposition Reason Codes chart. This table describes the charts that are available on the Process Metrics tab for Reason Code:Component Title
Description
Disposition Reason Code
Use this chart to view the count of dispositions categorized by disposition reason.
The chart depicts the disposition count vertically.