Process Metrics
The Process Metrics tab displays details such as Filter Criteria, Variables, Series Definition, Context Analytic, and so on for the related tables and business views of the selected enterprise process template. The Process Metrics is used to analyze and measure the overall performance of the process.
Click the Process Metrics icon. For the vouch match process model, you can review the settings in the read-only mode for these process metrics:
- Supplier Discount
- Voucher Variance
- Voucher Type
- Voucher Match
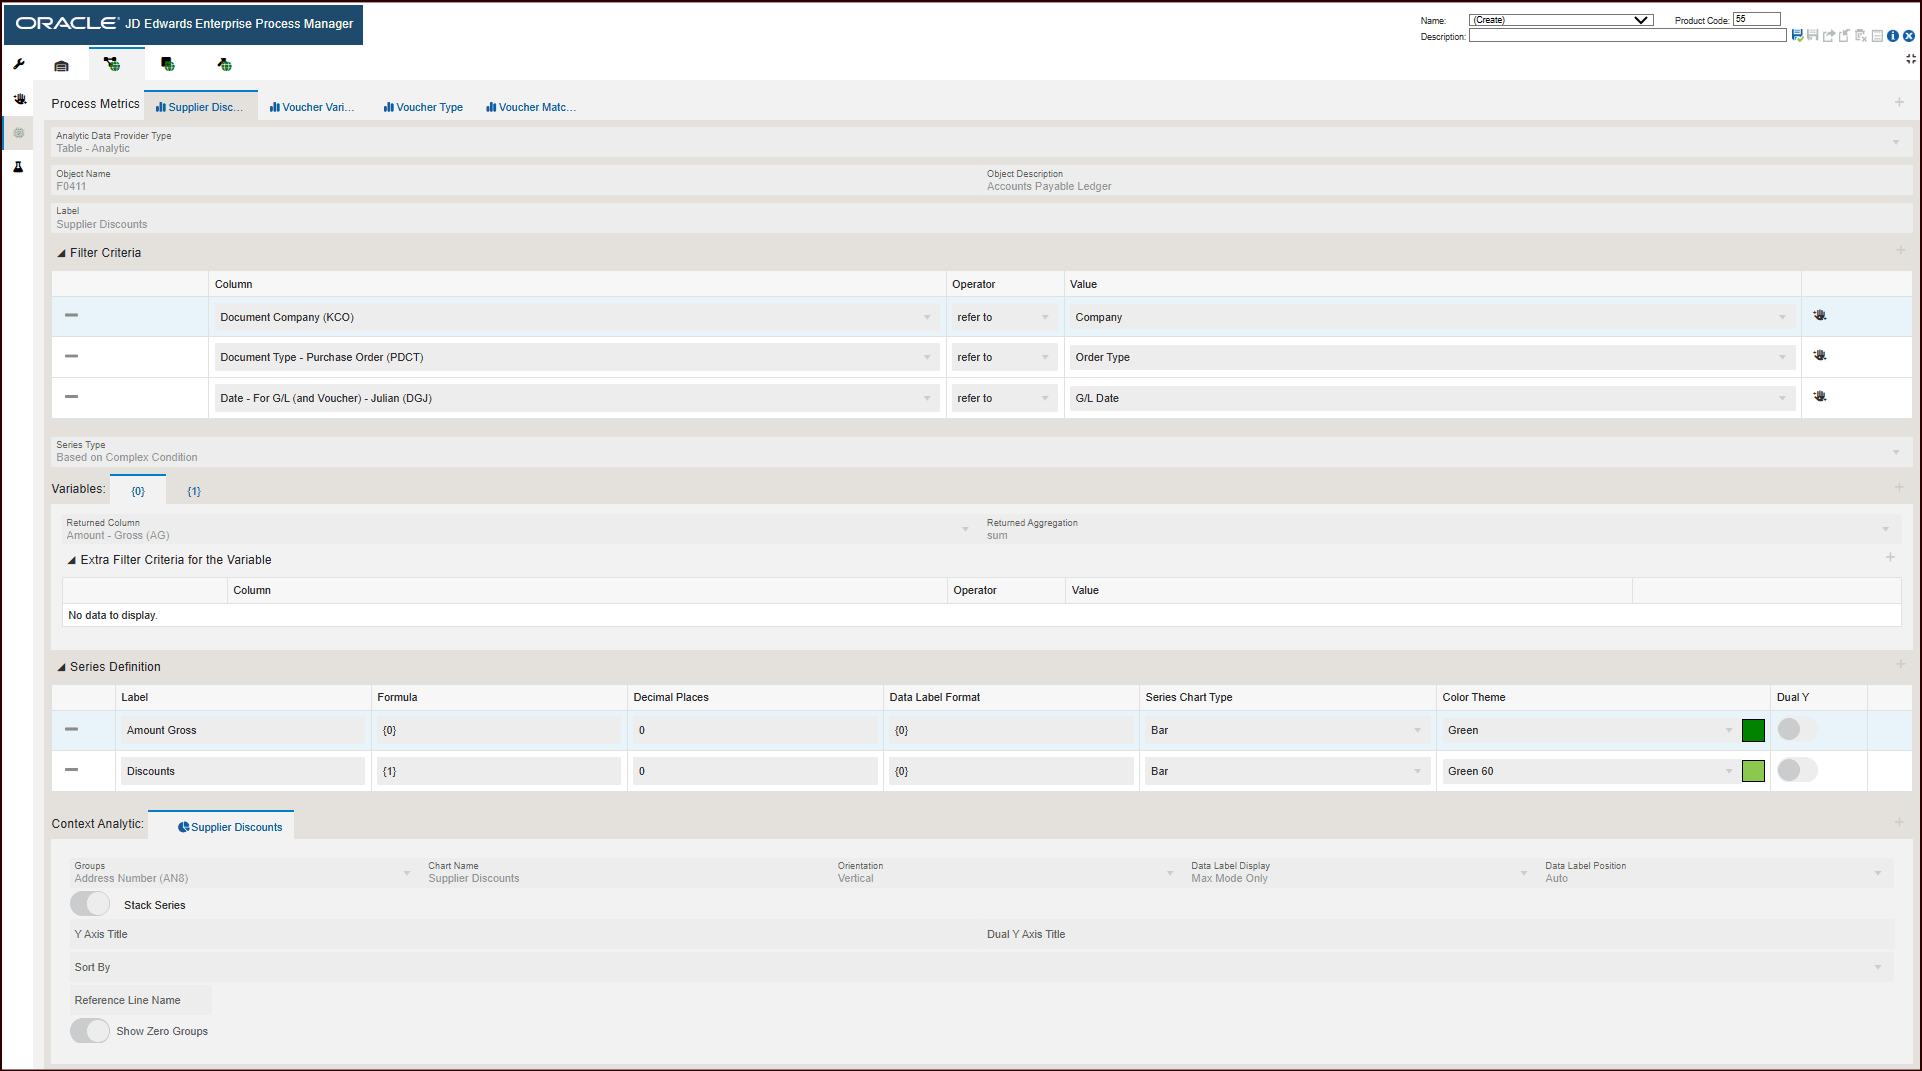
For the Supplier Discount process metrics displays the following:
- Object type: Table - Analytic
- Object Name: F0411
- Object Description: Accounts Payable Ledger
- The Filter Criteria displays the list of columns that are considered for filtering and the value each column is referring to. These filter options are displayed when you click the Show Filter Options icon to analyze the enterprise process. For more information, see "Using the Show Filter Options".
- The Series Type selected is Based on Complex Condition. This criteria returns standard aggregated values from View to display the values on charts in preview mode.
- The Series Definition section defines the formula to calculate the
Supplier Discount.
The system calculates the supplier discount using the gross amount and discount percentage.
- The system uses the data in Context Analytic section to generate charts. For every row in this section, a unique chart is generated.
Charts
Based on the details in the Context Analytic section, the data is grouped in the Process Metrics tab. In Enterprise Process Modeler, the Supplier Discounts, Voucher Variances by BP, Voucher Types, and VMA Invoice Status charts are generated.
This table lists and describes the charts that are available on the Process Metrics tab for supplier discounts:
|
Component Title |
Description |
|---|---|
|
Supplier Discounts |
Use this chart to view the discounts by supplier. The grouping is based on Address Number. The chart depicts the discount percentage by supplier vertically. |
Click the Voucher Variances by BP tab. The process metrics displays the following information:
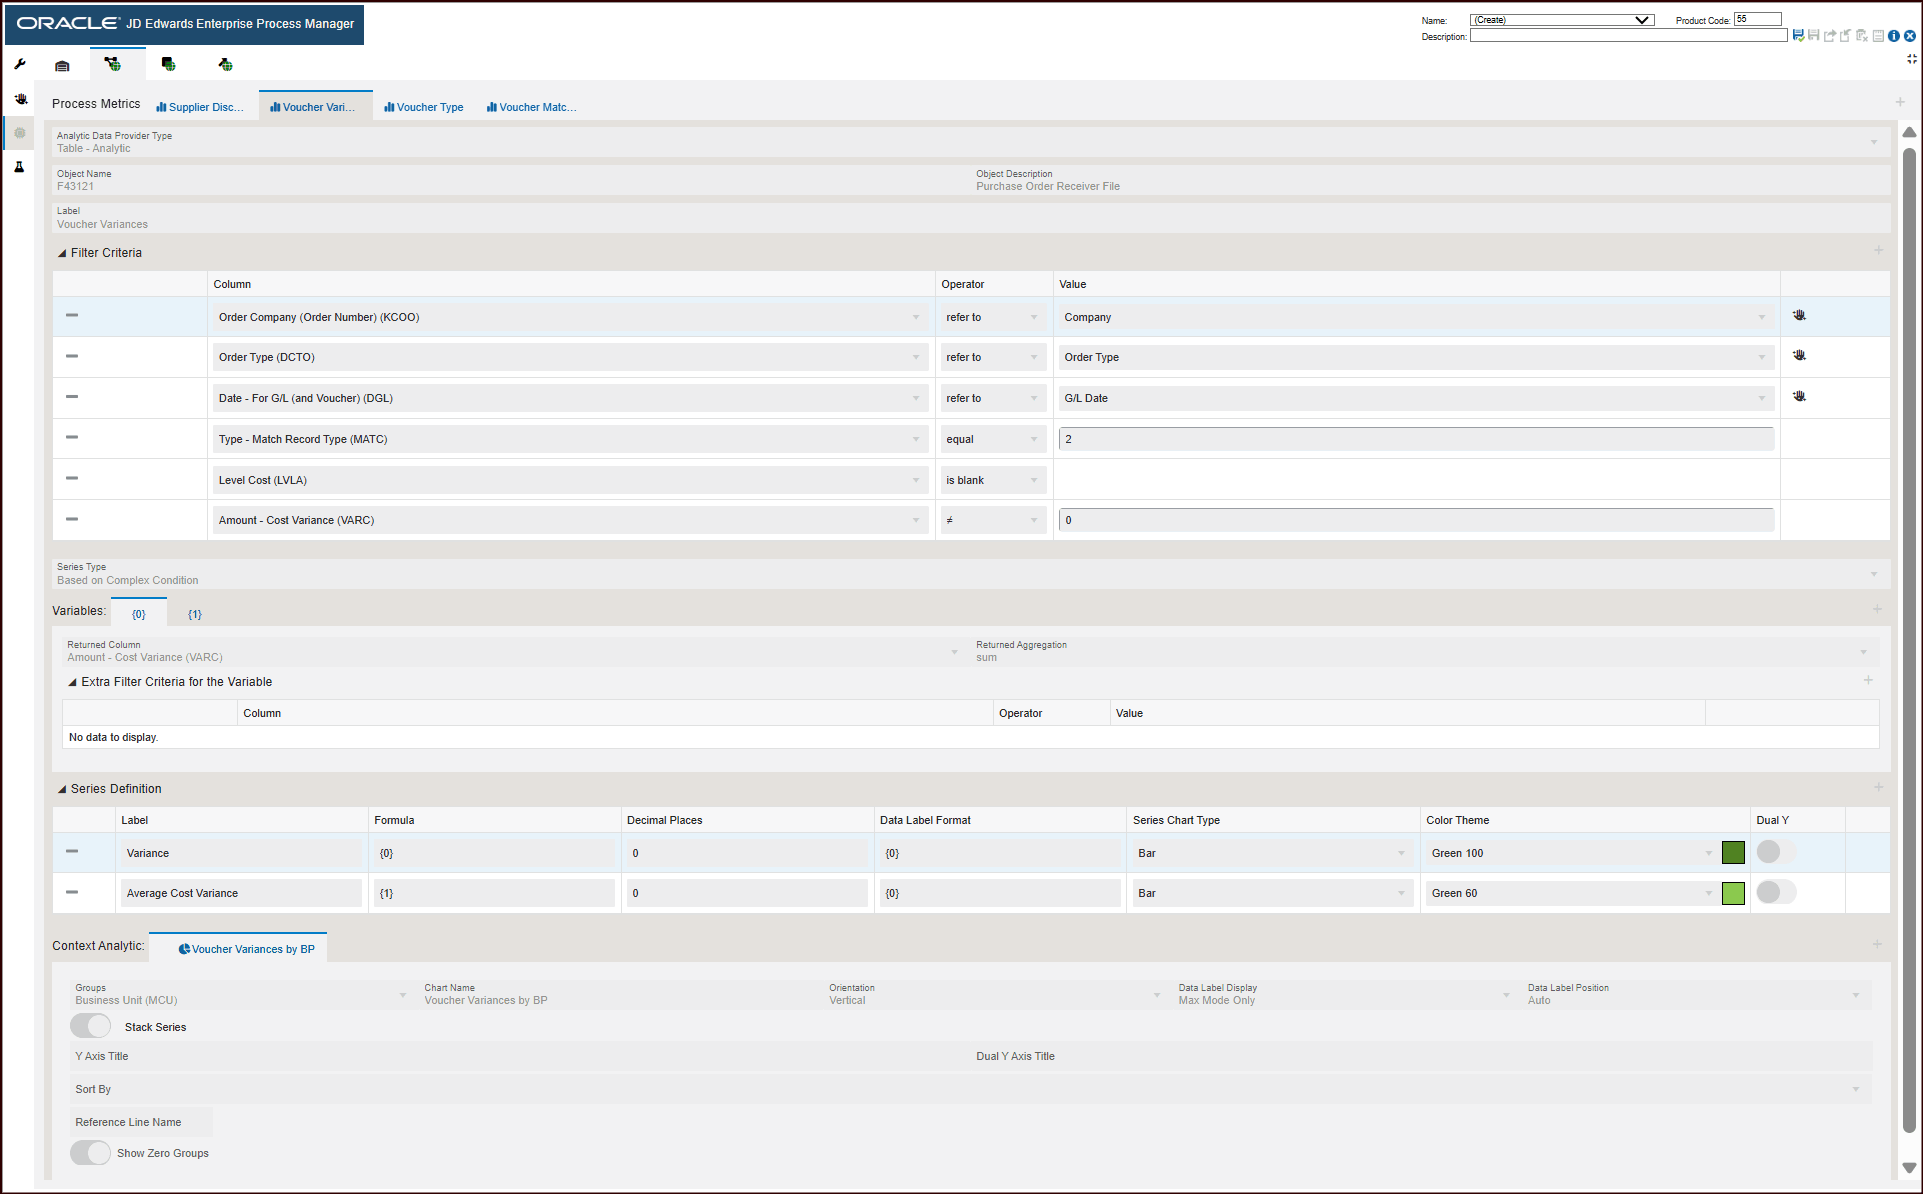
- Object type: Table - Analytic
- Object Name: F41321
- Object Description: Purchase Order Receiver File
- The Filter Criteria displays the list of columns that are considered for filtering and the value each column is referring to.
- The Series Type selected is Based on Complex Condition. The system performs mathematical calculations based on the variables defined under Variables and uses the formula provided in the Series Definition section and displays these values in the charts.
- The Variables section defines each of the Variable ID and the status approval values for them.
- The Series Definition section defines the formula to calculate the
Variance and Average Cost Variance.
The system calculates the voucher variance using the specified formula.
- The system uses the data in Context Analytic section to generate charts. For
every row in this section, a unique chart is generated.
Charts
For the voucher variance metrics, the Voucher Variance is grouped by Address Number column and is represented in the Voucher Variances by BP chart. This table lists and describes the charts that are available on the Process Metrics tab for voucher variance:Component Title
Description
Voucher Variances by BP
Use this chart to view the voucher variance by branch plant. The grouping is based on Address Number.
The chart depicts the average cost variance in voucher match vertically.
Click the Voucher Type tab. The process metrics displays the following information:
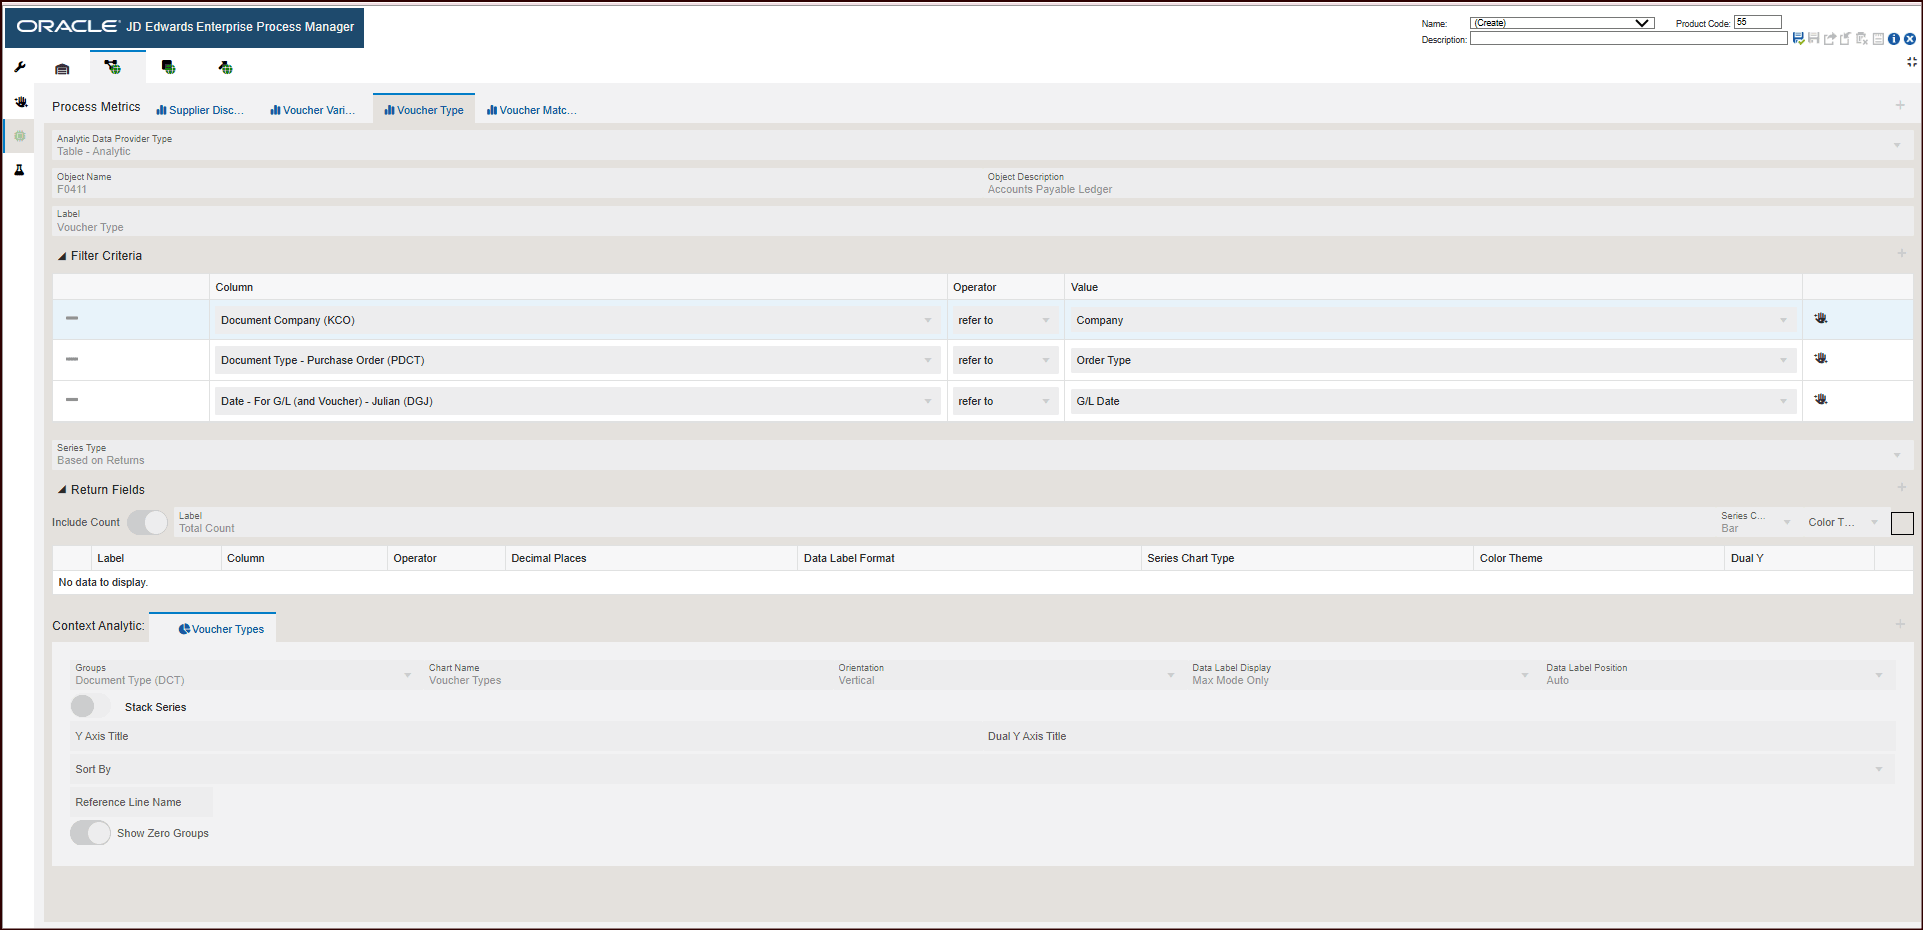
- Object type: Table - Analytic
- Object Name: F0411
- Object Description: Accounts Payable Ledger
- The Filter Criteria displays the list of columns that are considered for filtering and the value each column is referring to.
- The Series Type selected is Based on Returns. The system performs calculations based on the filter criteria and return fields specified and displays these values in the charts.
- The system uses the data in Context Analytic section to generate charts. For
every row in this section, a unique chart is generated.
Charts
For the Voucher Type metrics, the Vouchers are grouped by Voucher Type and are represented in the Voucher Type chart. This table lists and describes the charts that are available on the Process Metrics tab for voucher type:Component Title
Description
Voucher Type
Use this chart to view the vouchers count by type. The grouping is based on voucher type.
The chart depicts the voucher count by voucher types vertically.
Click the Voucher Match tab. The process metrics displays the following information:
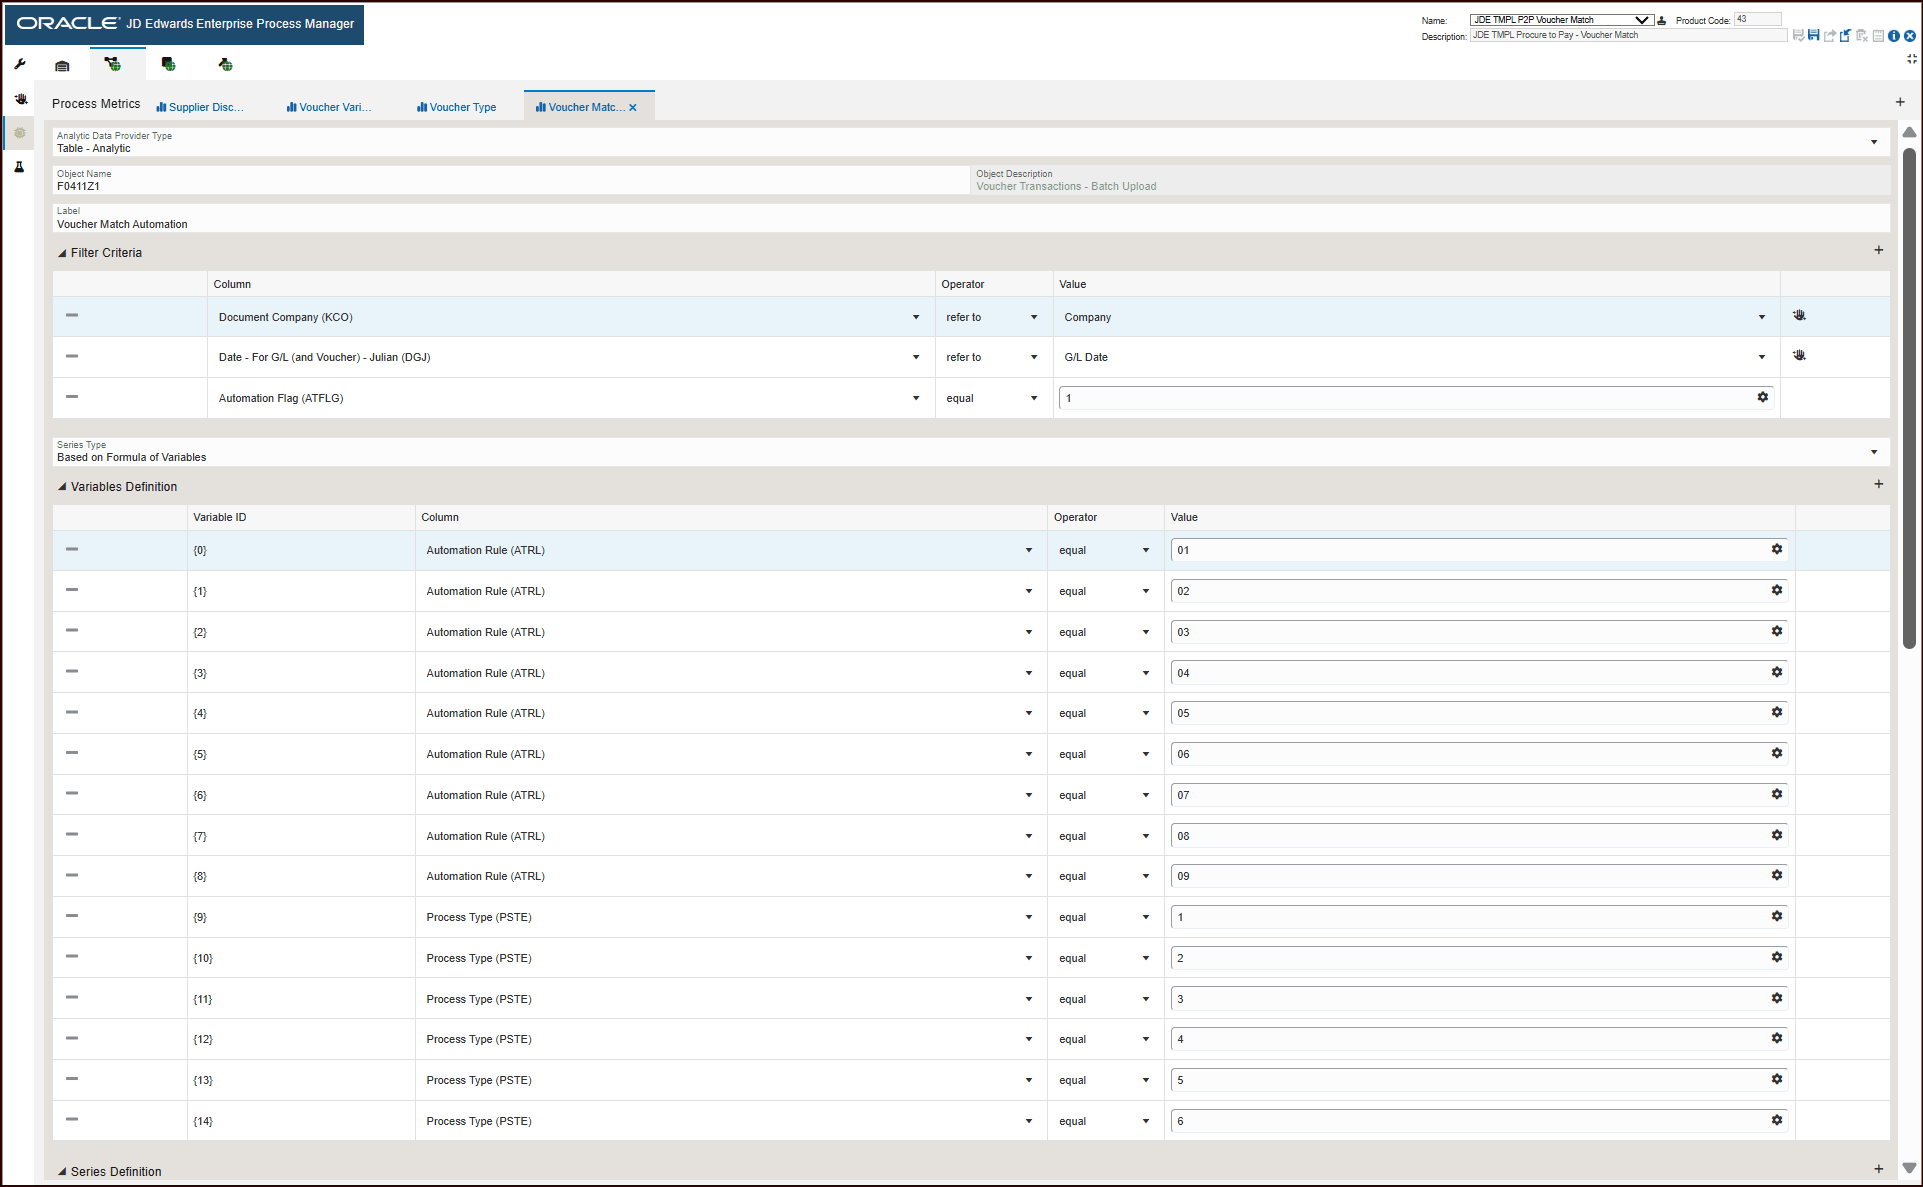
- Object type: Table - Analytic
- Object Name: F0411Z1
- Object Description: Voucher Transactions - Batch Upload
- The Filter Criteria displays the list of columns that are considered for filtering and the value each column is referring to.
- The Series Type selected is Based on Formula of Variables. The system performs mathematical calculations based on the variables defined under Variables Definition and displays these values in the charts.
- The Variables Definition section defines each of the Variable ID and the status approval values for them.
- The Series Definition section defines the formula to calculate the VMA Invoice Status.
- The system uses the data in Context Analytic section to generate charts. For
every row in this section, a unique chart is generated.
Charts
For the Voucher Match metrics, the VMA Status is grouped by Address Number and is represented in the VMA Invoice Status chart. This table lists and describes the charts that are available on the Process Metrics tab for Voucher Match:Component Title
Description
VMA Invoice Status
Use this chart to view the VMA (Voucher Match Automation) invoice status by branch plant. The grouping is based on Address Number.
The chart depicts the count of VMA invoice statuses by branch plant vertically.