 Before You Begin
This 30-minute OBE (Oracle By Example) shows you how to create an orchestration to check for the health status of a server instance and provide a report of the health status as a message.
In this OBE, you will create an orchestration with an Open API connector to call a REST service that retrieves the Server Manager information. You will then add a connector and a message step to the orchestration. Lastly, you will test the orchestration to verify that it returns the requested data and sends the message.
In this OBE, you will:
-
Create a connection to the Server Manager Console
-
Create the connector to retrieve the health status
-
Create an orchestration that calls the connector
-
Create a message to send the health check summary
-
Test the final orchestration
In the Orchestrator Studio, you can configure a connector to invoke a REST service. The Connector design page in the Orchestrator Studio provides a test feature that enables you to test the connector and view the JSON response of the REST service call. This exercise sends a message to Work Center. If your environment is configured with an SMTP e-mail server, you can alternatively send the message to an e-mail address.
What Do You Need?
To perform the steps in this OBE, you will need:
- An AIS Server version 9.2.5.0 or higher is running and accessible.
- An instance of server running on the Server Manager Console 9.2.5.0 or higher to which you want to make a connection.
- A EnterpriseOne user with an address book number associated where the address record exists in the address book table and does not have any associated e-email addresses where the delivery flag is 1. The deliveries need to go to work center for this address number.
- Access to Orchestrator Studio.
 Creating
a Connection to the Server Manager Console
A connector service request requires a connection, which will list all the REST services (API calls) that can be invoked through the Server Manager Console.
In this section, you will create an OpenAPI connection to list all the REST services on the Server Manager.
- On the Orchestrator Studio Home page, click the Connections icon.
- Click New and select Open API.
- On Connection Information, complete these fields:
- Name:
Health Check - Description:
Connection for Health Check - Type: Select Open API from the drop-down list.
- User/Role: Enter the user authorized to access the connection. The user can be an EnterpriseOne user, role, or *PUBLIC.
- Environment: Enter the environment where the connections reside.
- On the Service Information tab, in the OpenAPI Catalog
field, enter the URL for accessing the Open API documentation,
through which you can access the Server Manager REST services.
Example:https://Server_manager_Console_host:port/manage/mgmtrestservice/v1/open-api-catalog - On the Security tab, select Basic Authentication and complete these fields to enable access to the Server Manager Console:
- User: Enter an EnterpriseOne user authorized to access the Server Manager Console.
- Password: Enter the password for the EnterpriseOne user.
- Enter proxy information on the Proxy tab if necessary for your network configuration.
- Save the record.
- The system automatically populates the details about the API
including the Endpoint in the drop-down list where you can
select from multiple endpoints if available.
For this example, let's leave the value as is and use the https endpoint.
Optional: You can use the Test Connection button to test the connectivity to the endpoint as well as to download the catalog. - Save the record again.
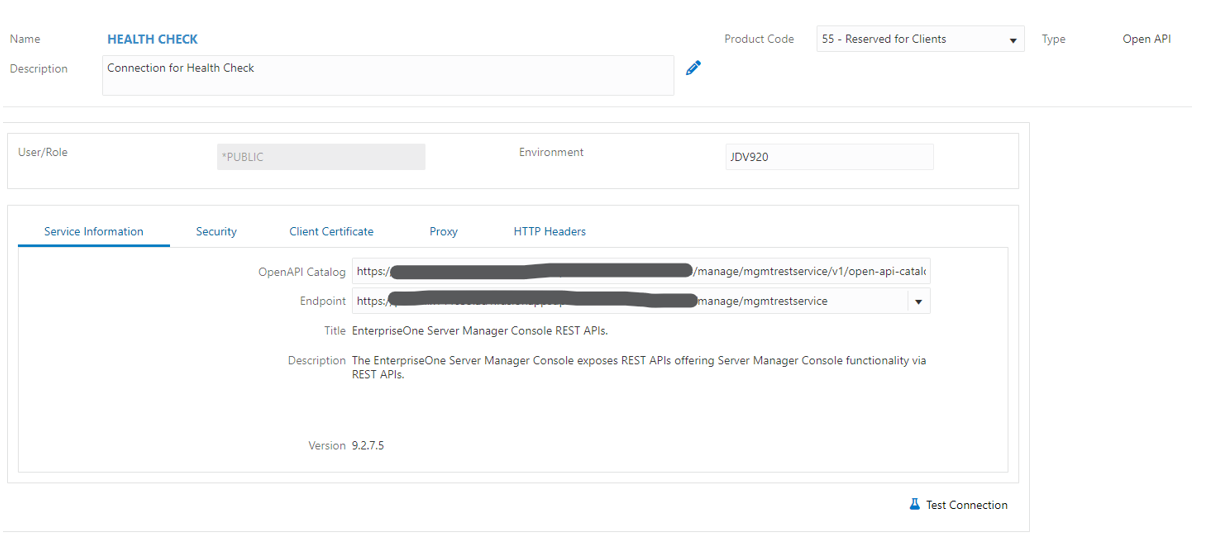
The Open API connection should look like the following screenshot:
 Creating
the Connector to Retrieve the Health Status
In this section, you will create a connector that retrieves the health check summary of the instance.
- On the Orchestrator Studio Home page, click the Connectors icon.
- On the Connectors page, click the New button and select Open API.
- On the Connectors page, complete the following fields:
■ Name:Health Check SR
■ Description:Health check of the instance - In the Open API drop-down list, select the
Connection for Health Check - HEALTH CHECK.connection that you created in the previous section. - Click the API drop-down list and select
/health. The system may populate this value automatically along with the HTTP Method of POST. - Modify the Body section to only request
the health of one instance.
                    {

                    "instanceName": "${instanceName}"

} - Remove the TOKEN and AUTHORIZATION rows from the Headers
section (Click X).
Only Content-Type and Accept will remain. - Save the connector. Now, you can test the connector to view the output.
- Click the Test button (Note: Do not confuse this with the Test Connection button.)
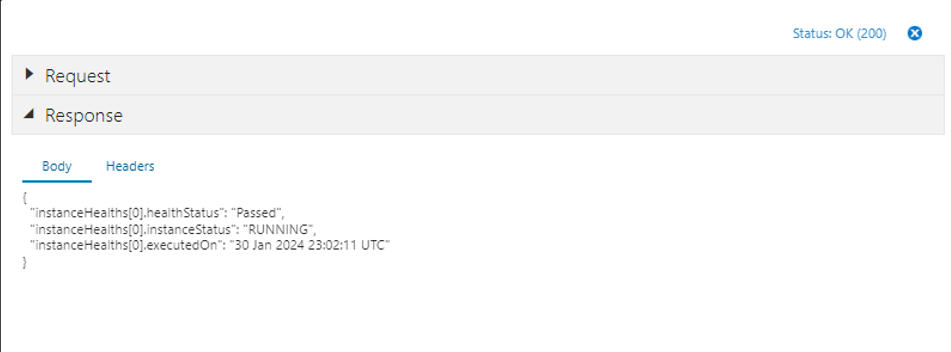
- In the dialog window, enter the name of a managed instance, then click Execute. Wait for the service to complete.
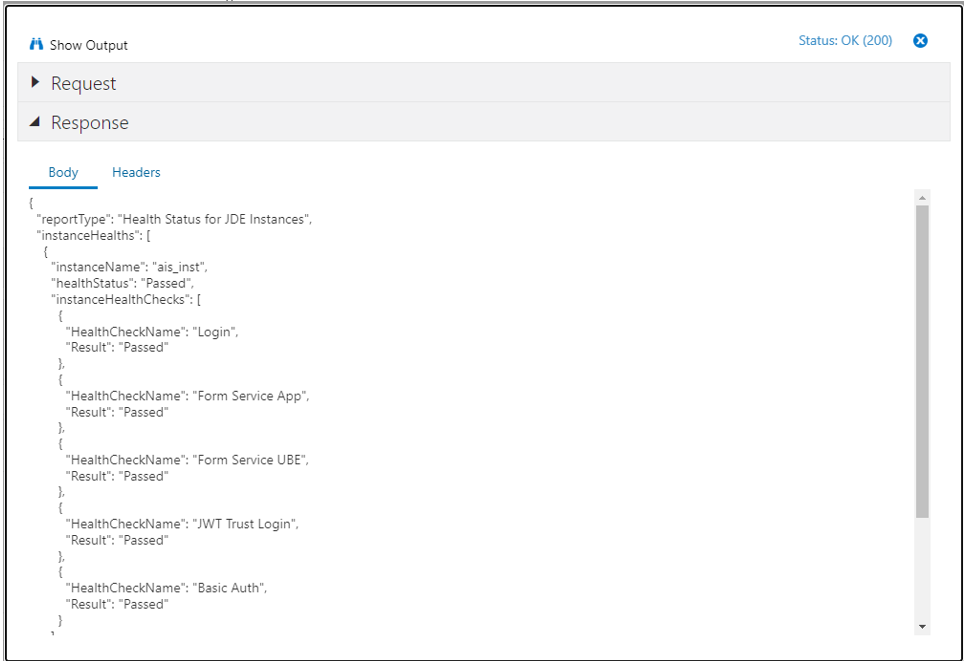
- Verify that the dialog window displays the output of the service call as shown in the following screenshot:
- Close the dialog (Click the X button).
Now that we know the output of the service, we can configure the connector to return only the values we need. - Expand the Response and Output sections.
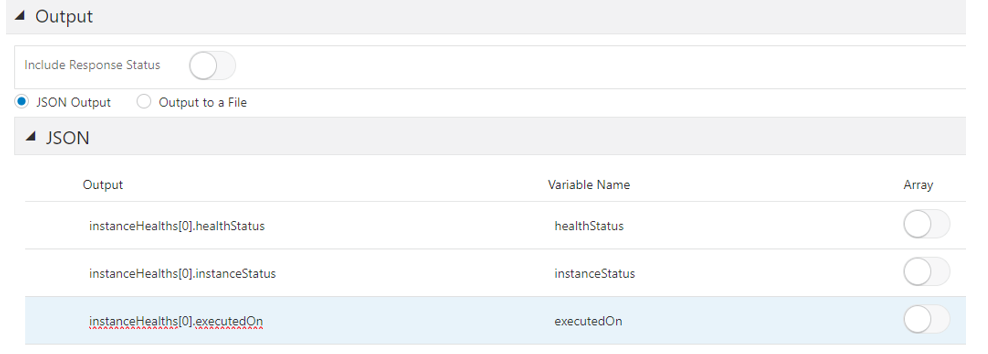
- In the output section, populate the following rows, using
JSON path notation for the output array.
The array in the response isinstanceHealths. Since we only need the first record, the index is zero.
The fields required from the records in the output array are: healthStatus, instanceStatus, executedOn.
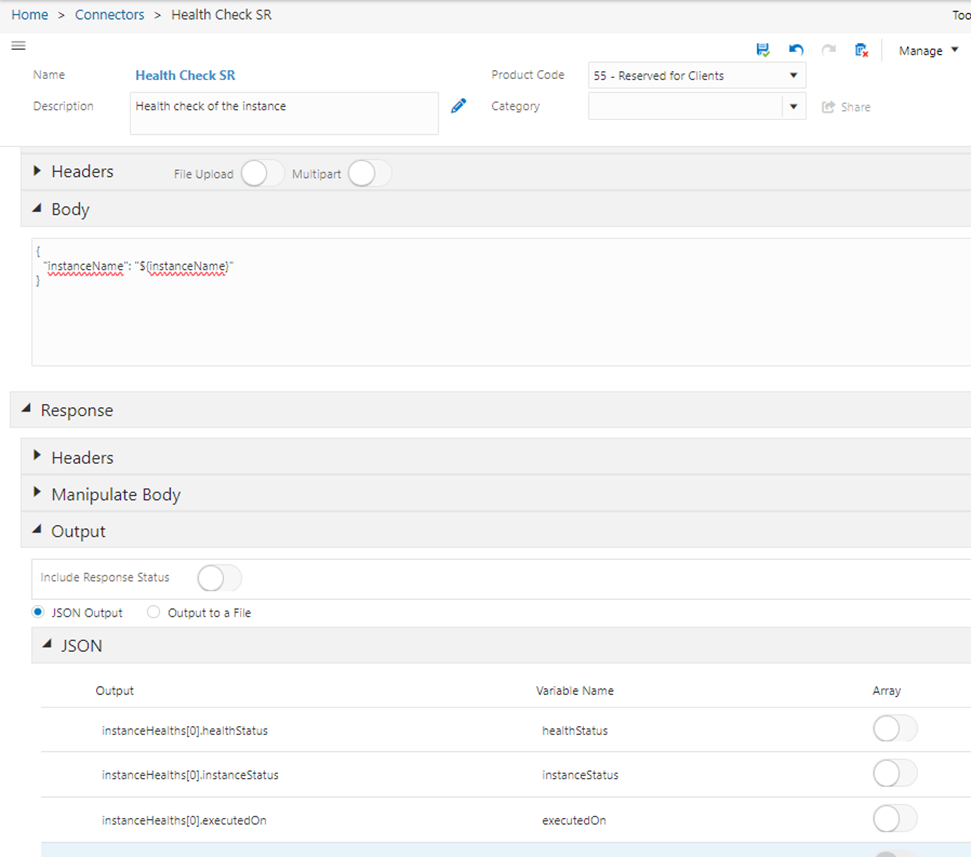
We will also include variables for these three values so that we can use them in the message step later. Add these names to the Variable Name column as shown in the following screenshot: - Save the connector request. The Health Check SR connector should look like this:
- Click Test again to test the final connector output.
- In the dialog window, enter the instance name and wait for the service to complete.
- Click the Show Output button.
- Verify that the output contains only the three defined values.
- Close the window.

 Creating
an Orchestration that Calls the Connector
In this section, you will create an orchestration to perform health check of an instance. This task involves creating an orchestration using the Health Check SR connector that you created in the previous section.
- From the Orchestrator Studio, access the Connector page and open the Health Check SR connector.
- Click the Manage drop-down list, and
click Create Orchestration. The system will
automatically create an orchestration, and the
orchestration page is displayed. Save the new orchestration.
You can see that the new orchestration is created with the Health Check SR step with mapped inputs and selected outputs. - On the Orchestration design page, change the values in these
fields:
■ Orchestration:Health Check Orchestration
■ Description:Orchestration to perform health check - Click Save. Verify the automatically mapped inputs.
- Click the Start icon of the orchestration and then click Inputs and Values. Verify that the window displays one input: instanceName. Enable the Required option for the instanceName Input.
- Click anywhere outside the Inputs and Values window to close the window. Click the Heath Check SR step in the orchestration, and then click the Transformations icon. Verify that the system displays one mapping for instanceName.
- Click anywhere outside the Transformations window to close it. In the orchestration, click the End icon, and then click Outputs and Assertions.
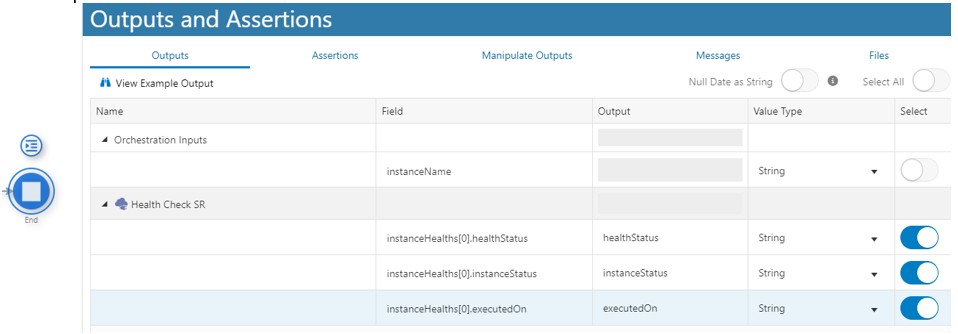
- Change the values in the Output column to simplify the outputs by removing the instanceHealths[0] portion of the name. Enable the Select option for the three values if they are not already selected. The outputs should look like this:
- Save the Orchestration.
- To test the orchestration, double-click the Start icon.
- In the Run Orchestrations window, in the Name filed, enter an instance name.
- In the Inputs section, enter values for the following
inputs:
■ instanceName - Click Run.
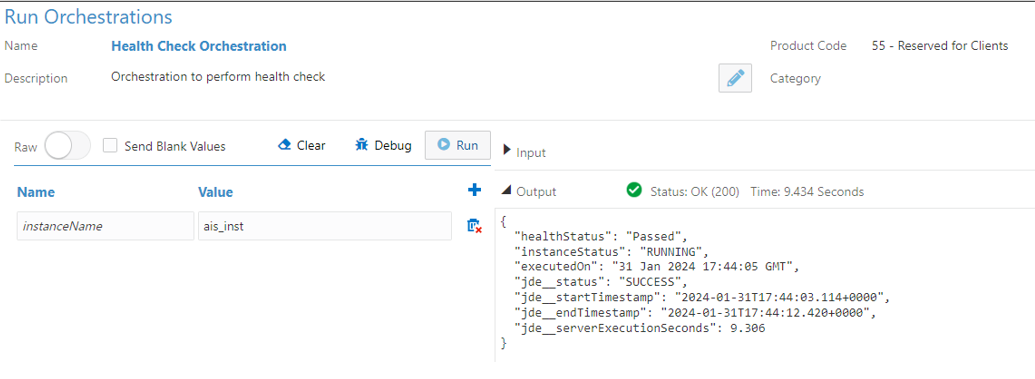
- The test result should look like this:


 Creating
a Message to Send the Health Check Summary
In this section, you will add a message step to the orchestration to send the health check summary.
- Access the Health Check orchestration.
- Double-click on the line segment between the Health Check SR
and End icons. In the New Step Type window, click Message.
Alternatively, you can click the Design Mode button and click the + icon to add a new Message step. - Click New.
- On the Message page, complete these fields:
■ Name:Health Check Message
■ Description:Health check of an instance - In the To field, select Address Book Address as the recipient’s name.
- In the Address Book field, enter
${toAddress}as a variable. - In the Subject field, enter
Health Check Report ${instanceName}. - In the body field, enter the following message:
                    Hi,

                    Please find the Heath Report for the ${instanceName}
                    instance as follows: Health Status: ${healthStatus}

                    Instance Status: ${instanceStatus}

Execution Time: ${executedOn} - Save the message.
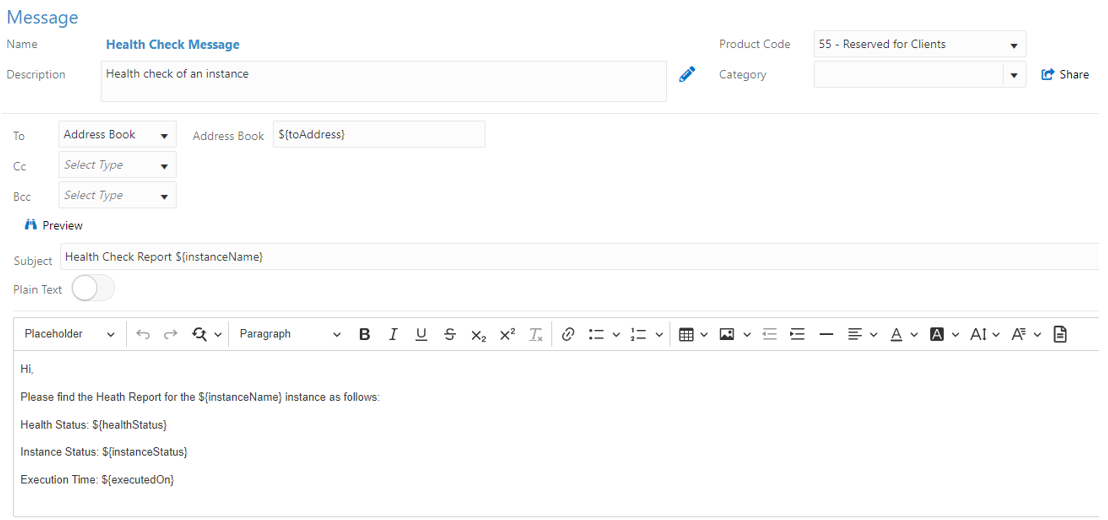
- The Health Check Message request should look like this:
- Click X to close the message.
The system adds the new message step to the orchestration. - Click the Start icon and then click the Inputs
and Values icon. In the Orchestration Inputs tab,
add
toAddressin the Input field, and enable the Required option. - Click the message step and then click the Transformations icon.
- Click the Auto Map button. Verify that the Transformations windows looks like the following screenshot:
- Click the End icon and click Outputs and Assertions.
- Enable the Select option for success
output from the message step. Change the name to
Message
                    Success
.
Note: Earlier releases may not enable you to perform this step, but the message will still be sent. - Save the Orchestration



 Testing
the Final Orchestration
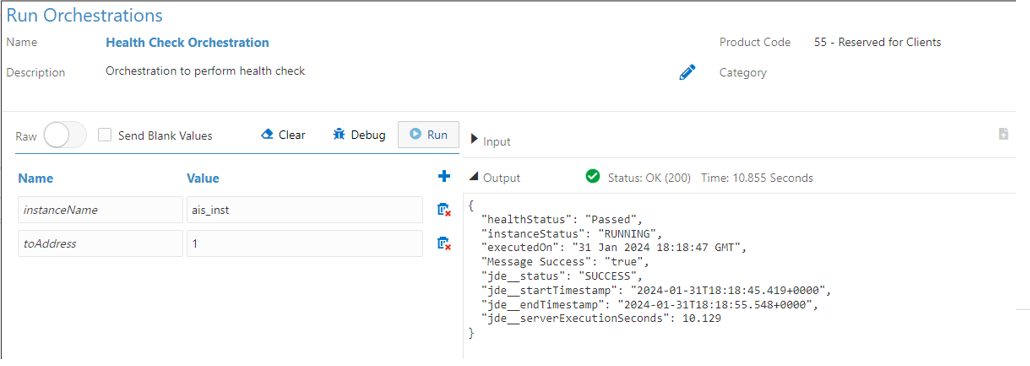
In this section, you will use the Run Orchestration page to test the orchestration and verify that it returns the output as defined in the orchestration and sends the email message.
- Access the Health Check Orchestration and double-click the Start
icon.
Alternatively, you can also use the Tools menu and select Run Orchestrations - In the Inputs area, enter values for the following inputs:
■ instanceName
■ toAddress: Enter the address number associated with your EnterpriseOne user - Click Run.
- Verify that the test result looks like the following screenshot:
- From the Tools menu, click JD Edwards EnterpriseOne.
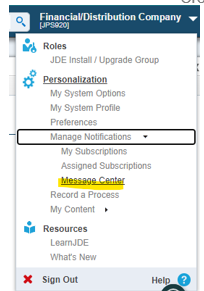
- In the user drop-down list in EnterpriseOne, click Manage Notifications, and then click Message Center.
- Click the Work Center tab, expand Personal In Basket.
- Click the Health Check Report message received.
- Verify that the message you received looks like the following screenshot:

 Creating
an Orchestration to Check the Health Status of a Server Instance