Before You Begin
Enterprise Automation is the collection of JD Edwards EnterpriseOne features targeted at getting better data into your JD Edwards system and getting better insights out of that data. It’s “digital gold.” But Enterprise Automation also refers to the techniques and disciplines we use to model and analyze that data as we seek to identify and solve impediments to improvement.
Enterprise Process Modeler is the primary tool for visualizing metrics and analytics in the context of a business process. Users of Enterprise Process Modeler, who are typically business process owners responsible for smooth and efficient business operations, can explore various dimensions of the business data within the EnterpriseOne system using data filters, groupings, and aggregations that produce metrics and analytic charts. As a process model designer, you use Enterprise Process Manager to create process models by:
-
Defining the process nodes (steps) and links between the nodes, either by pointing to an existing set of order activity rules or by a custom process definition
-
Pointing to data providers (tables, business views, logic extensions, and orchestrations) as the source of the business data
-
Defining data filters, data groupings, aggregations (sum, count, average, and so on.) over the data
-
Configuring metrics and analytics for users to visualize on the process model
You can accomplish these tasks by starting with a preconfigured process model template provided by Oracle JD Edwards product development, or you can create your own user-defined process model, which is the objective of this Oracle by Example (OBE).
In this OBE, you will build a process model for the Commercial Office Lease process. Because no preconfigured template exists for this process, you will build the process model step-by-step. You will:
-
Open the Lease Information application (P1501) and familiarize yourself with the business data. You will also add some data to facilitate a better viewing experience in the Enterprise Process Modeler.
-
Use the Process Definition application (P00201) to create a custom process definition to define the nodes and links of the Lease process model.
-
Use Enterprise Process Manager to ingest the process definition and draw a process model diagram.
-
Define data filters, which users can adjust to explore the data.
-
Define metrics for the nodes of the process.
-
Define analytic charts that are context-sensitive at the process level and at the node level.
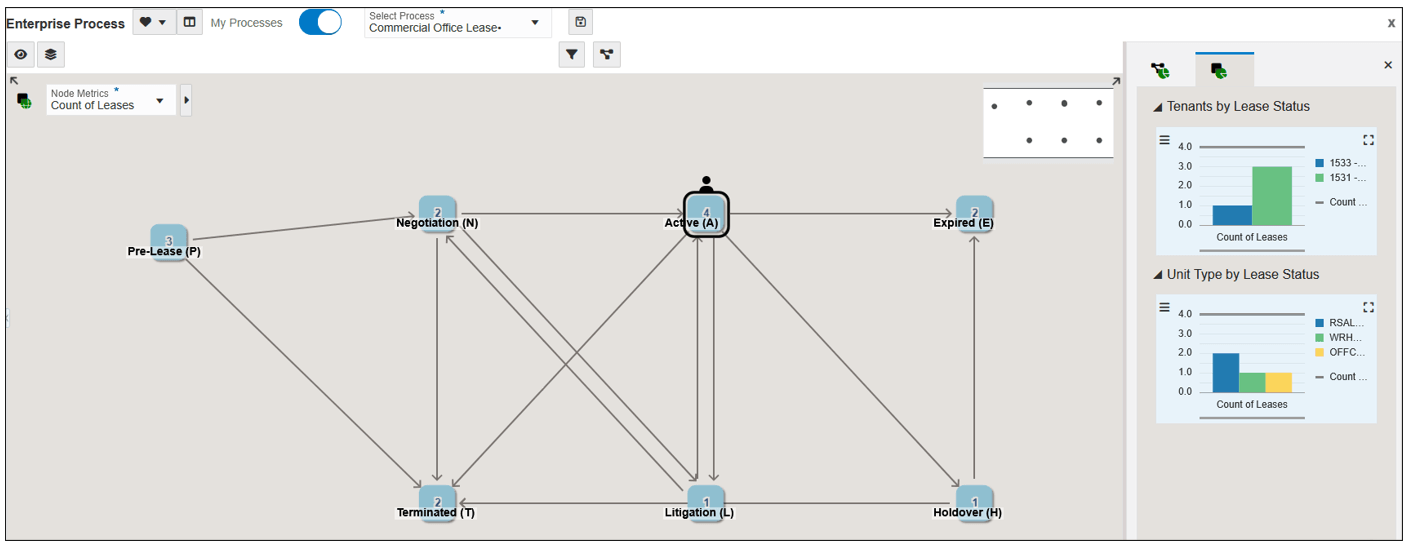
When you complete this OBE, your Commercial Office Lease Process will look similar to this:
What Do You Need?
To perform the steps in this OBE, you will need:
-
Access to a JD Edwards EnterpriseOne environment with Release 26 (Tools Release 9.2.26.2) or later. JD Edwards EnterpriseOne Trial Edition running on Oracle Cloud Infrastructure is suitable, but you can use any environment with the proper Tools release.
-
User-defined object security to create Enterprise Processes (PROCESS).
-
Access to Data Browser.
Time to Complete
2 hours.
Task 1: Reviewing Lease Data
Before you can create any process model, you must first be familiar with the process itself and the business data that it generates. For the scenario in this OBE, start by reviewing the business data for the Commercial Office Lease business process.
-
Sign in to the EnterpriseOne web client.
-
Optional, but recommended: From the User menu, click Preferences and select the Open Application In New Window option.
Turning on this option will allow you to easily switch between browser tabs for Enterprise Process Manager and the Lease Information application.
-
Click Save.
-
From the EnterpriseOne Home page, use Fast Path or navigate to Lease Information – Work with Leases (P1501).
-
On Work with Leases, click Find to load data into the grid.
The Work with Leases form might look different depending on the data in your system.
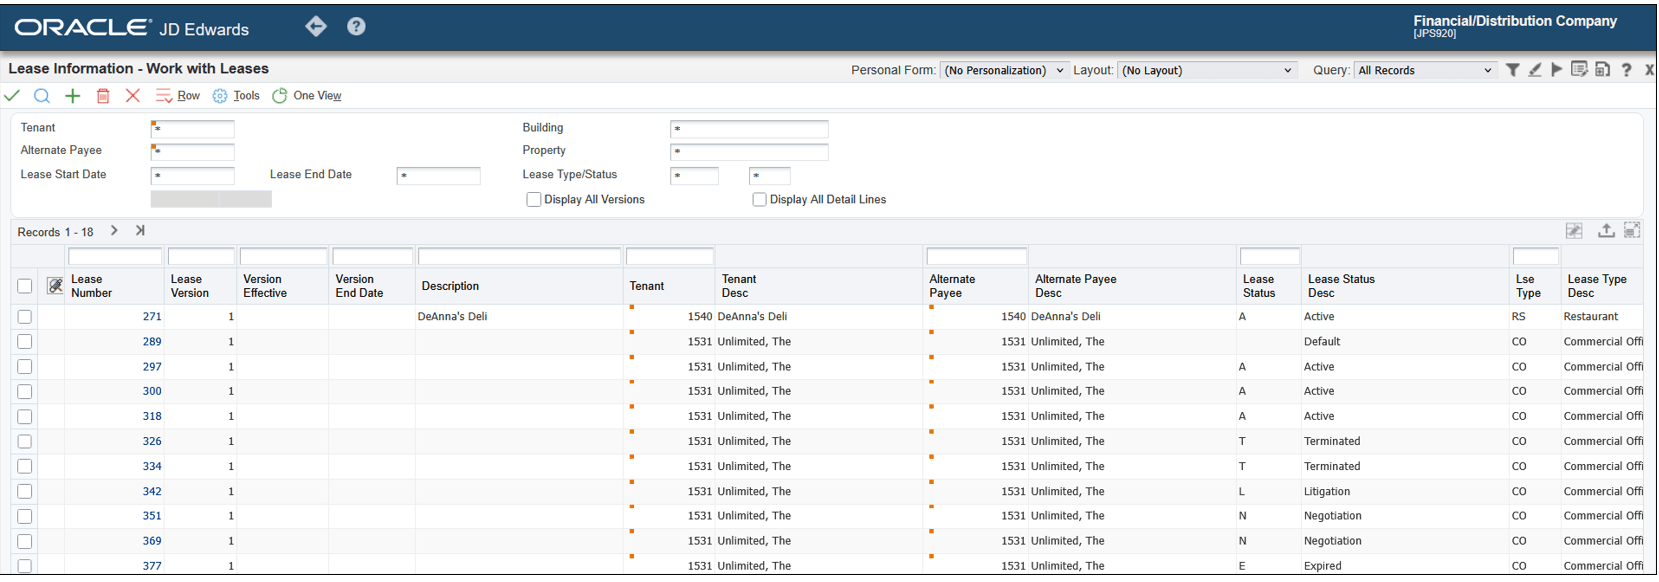
Lease Information - Work with Leases Take note of the following columns in this grid:
- Lease Number lists lease records in the
system. Later in this OBE, you will define an aggregation to
count these records.
- Lease Status provides status codes, stored
in UDC table 15/LS, to track the status of lease documents.
Later in this OBE, you will use these status codes to define the nodes of the process model.
- Lease Number lists lease records in the
system. Later in this OBE, you will define an aggregation to
count these records.
-
Click the Visual Assist (search icon) in the Query by Example header to see a list of the lease status codes:
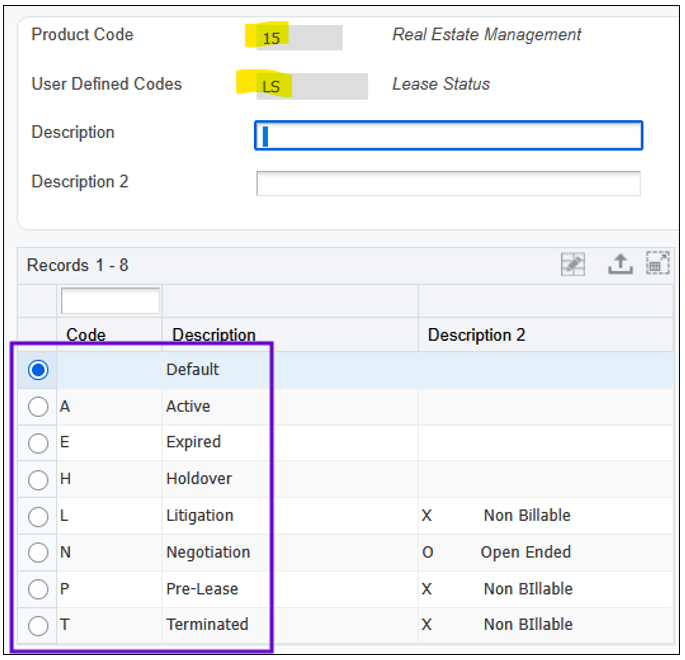
User-Defined Codes -
Lse Type (Lease Type) provides a filter for different types of leases. For the scenario in this OBE, you will restrict your process model to focus only on Commercial Office leases.
-
Enter
COin the Query-by-Example field and click Find to filter the grid for Commercial Office leases.Scroll to the right if necessary to see these additional grid columns:
-
Lease Begin Date and Lease End Date provide date filters. Later in this OBE, you will configure these filters in the process model so that users of Enterprise Process Model can filter metrics and analytics by these date fields.
The Lease Information application provides many additional grid columns for storing business data. While Enterprise Process Modeler can include any of this data into a process model, this OBE focuses only on the columns listed above for simplicity.
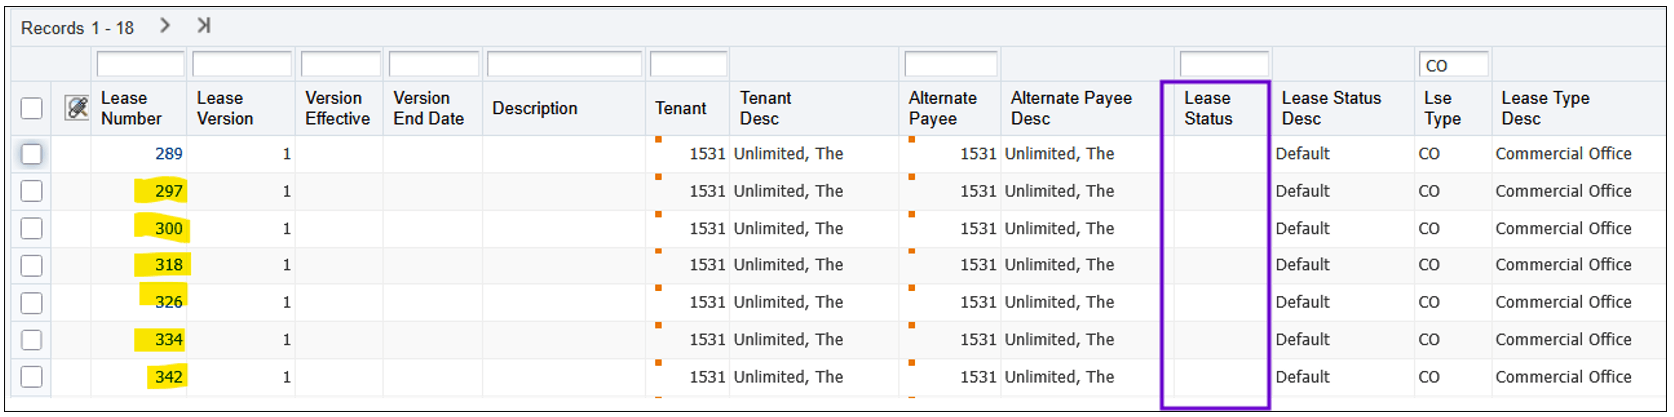
Depending on the data in your system, you might need to “enrich” the lease records so that the metrics and analytics you build later in this OBE can provide better visualizations. The demo data in JD Edwards Trial Edition is limited. Follow the steps below to assign statuses other than Default (blank) to several leases.
-
-
With the grid filtered for Lse Type =
CO, click Find. -
Click Go to End to load all records in the grid.
-
Click on a Lease Number, for example, 297, for which the Lease Status is blank.
-
On Lease Master Revisions, in the Lease Status field, enter
Afor Active. -
Click Save and Close.
-
Repeat steps 10 through 12 until you have many leases with different Lease Status codes. For the demo data in JD Edwards Trial Edition, here is a suggested list of statuses:
Lease Number
Statuses
297 A 300 A 318 A 326 T 334 T 342 L 351 N 369 N 377 E 385 H 393 P 406 P 414 P
Notice that many of the lease records have Default (blank) set for the Lease Status.
Note: Depending on your system configuration and data, some leases might generate errors upon editing. In the JD Edwards Trial Edition demo data, lease 289 is one example. If you encounter leases that you cannot edit, just skip them.
Task 2: Creating a Custom Process Definition
Enterprise Process Modeler draws a process model diagram based on a set of nodes and links between those nodes, thus depicting the flow of the process. A process definition is required to unambiguously describe the set of nodes and links between them. For some business processes, such as Order to Cash and Procure to Pay, order activity rules can be used as the process definition. Other business processes, such as the Lease process in this OBE scenario, do not have order activity rules. In such cases, you can use the Process Definition application (P00201) to define the nodes and allowable transitions between nodes (links) in much the same way as order activity rules.
-
At the EnterpriseOne Home page, use Fast Path or navigate to the Process Definition application (P00201).
-
On Work With Process Definition, click Find to display the existing process definitions in your system. If none exist, the grid will be empty.
-
Click Add (+) to add a new process definition.
-
On Process Definition Revision, complete the following fields:
-
Process Definition ID: The system assigns this field automatically as a Next Number.
-
Process Description: A descriptive name for your process. Enter
Lease Process. -
Product Code: The product code for the User Defined Code (UDC) table that holds the list of statuses to represent the nodes on the process model diagram. Recall from the previous exercise you saw UDC table 15/LS. Enter
15. -
User Defined Codes: The specific UDC table that holds the status codes. Enter
LS.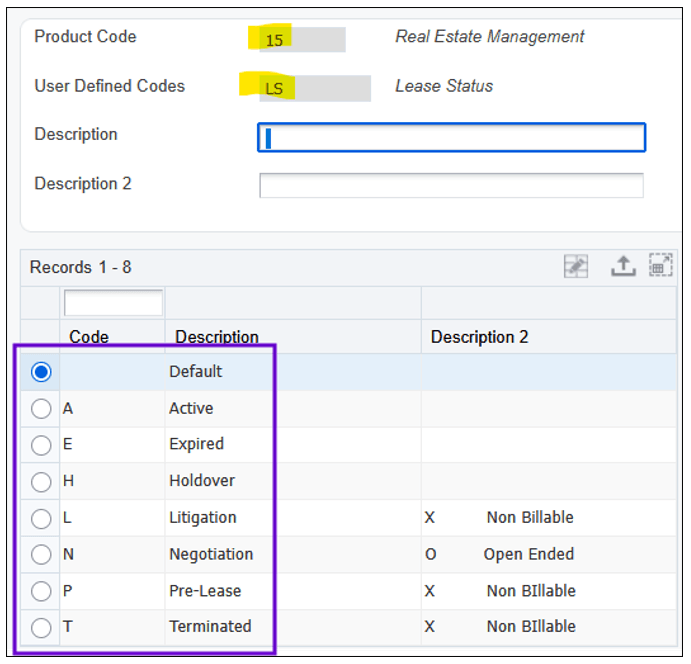
Process Definition Revisions - User-Defined Codes 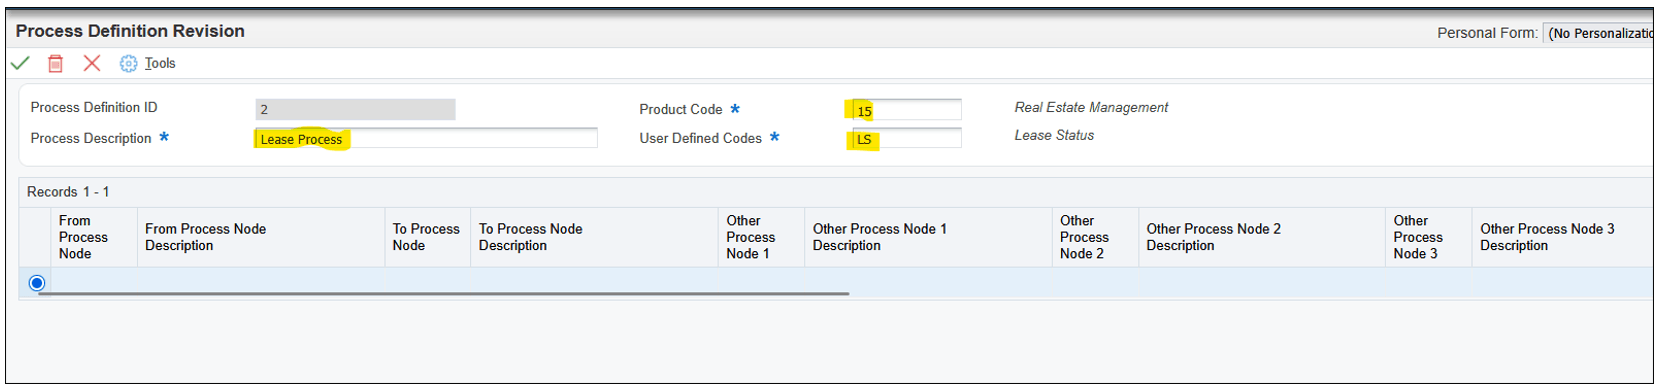
Process Definition Revision Form
For the Lease process, the Lease Status codes will act as the nodes in the process. In the next steps you will enter data into the grid to describe for each node (status) the allowable paths to other nodes.
-
-
Click in the From Process Node field in the first grid row and enter the first node (status) of the Lease Process:
P(Pre-Lease).From the Pre-Lease status, we can define that the process would flow next to the N (Negotiation) status, but it might also go directly to T (Terminated).
-
In the first grid row, in the To Process Node field, enter N (Negotiation). In the Other Process Node 1 field, enter
T(Terminated). -
In the second grid row, in the From Process Node field, enter
N(Negotiation).-
In the To Process Node field, enter A (Active). This is the normal or likely path.
-
In the Other Process Node 1 field, enter L (Litigation). This is an alternate path.
-
In the Other Process Node 2 field, enter T (Terminated). This is an alternate path.
Next, define the paths from the A (Active) node.
-
-
In the third grid row, in the From Process Node field, enter
A(Active).-
In the To Process Node field, enter
T(Terminated). This is the normal or likely path. -
In the Other Process Node 1 field, enter
E(Expired). This is an alternate path. -
In the Other Process Node 2 field, enter
L(Litigation). This is an alternate path. -
In the Other Process Node 3 field, enter
H(Holdover). This is an alternate path.
-
-
In the fourth grid row, in the From Process Node field, enter
T(Terminated). Leave the remaining fields blank in this row. This indicates that T (Terminated) is an endpoint for the process. -
In the fifth grid row, in the From Process Node field, enter
E(Expired). Leave the remaining fields blank in this row. This indicates that E (Expired) is an endpoint for the process. -
In the Sixth grid row, in the From Process Node field, enter
L(Litigation).-
In the To Process Node field, enter
A(Active). This is the normal or likely path. -
In the Other Process Node 1 field, enter
N(Negotiation). This is an alternate path. -
In the Other Process Node 2 field, enter
T(Terminated). This is an alternate path.
-
-
In the Seventh grid row, in the From Process Node field, enter
H(Holdover).-
In the To Process Node field, enter
T(Terminated). This is the normal or likely path. -
In the Other Process Node 1 field, enter
E(Expired). This is an alternate path.
-
-
When the process definition grid matches the example shown above, click OK.
-
On the Work with Process Definition form, click Find to refresh the grid and see your new process definition listed.
Take note of the uniquely assigned Process Definition ID and the Process Description.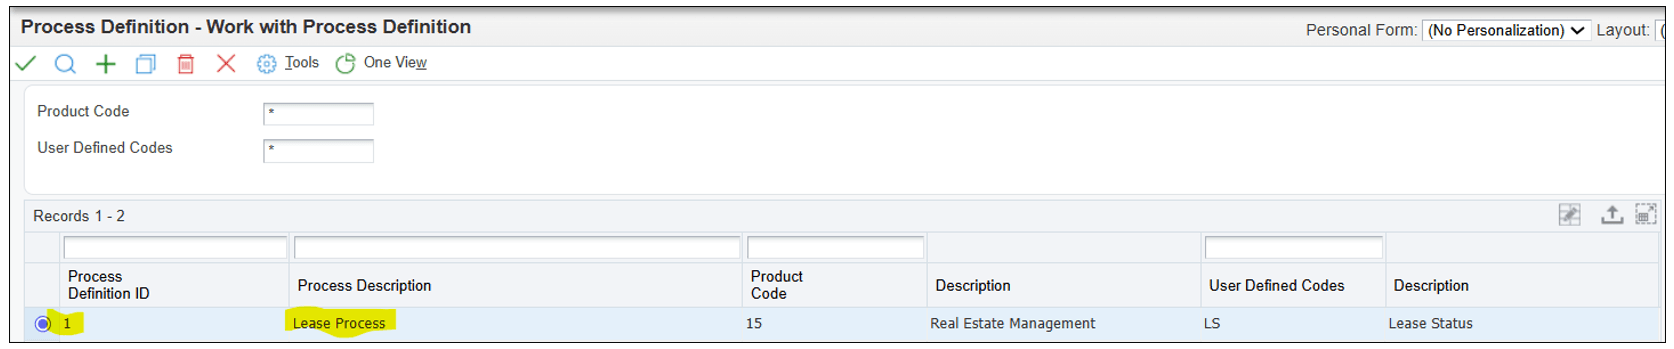
Work With Process Definition - Process Definition ID
Enterprise Process Modeler can now use the data in this process definition to draw a process model diagram for the Lease Process. You’ll do this in the next exercise.
In a similar manner, we must define where the process flows from the N (Negotiation) status. Let’s define that the process could flow from N (Negotiation) to A (Active), or alternatively to L (Litigation) or T (Terminated).
Now you have defined normal paths and alternate paths for each node in the process. Make sure each Status that is listed in a To Process Node or Other Process Node is also listed on its own row in a From Process Node field. Your process definition grid should look like this:
Note: Additional Other Process Node columns (up to 10) are available in the grid to support more complex process definitions.
Task 3: Generating a Process Model Diagram
In the previous exercise, you used the Process Definition application to define the nodes (Lease Status codes) and links (From Process Node and To Process Node). Using this information, Enterprise Process Modeler can automatically draw a process model diagram of the Lease Process.
-
From the EnterpriseOne web client Home page, from the User menu, click Manage Content, and then click Processes.
The system displays the Enterprise Process Manager window, which is the design tool for creating process models.
-
If there are no other process models already in the system, Enterprise Process Manager displays the Create Process window.
If other process models exist in the system, select (Create) from the Name drop-down list to create a new process model.
-
On the Create Process window, click the Foundation of Process drop-down list and select User-defined.
-
Click OK.
-
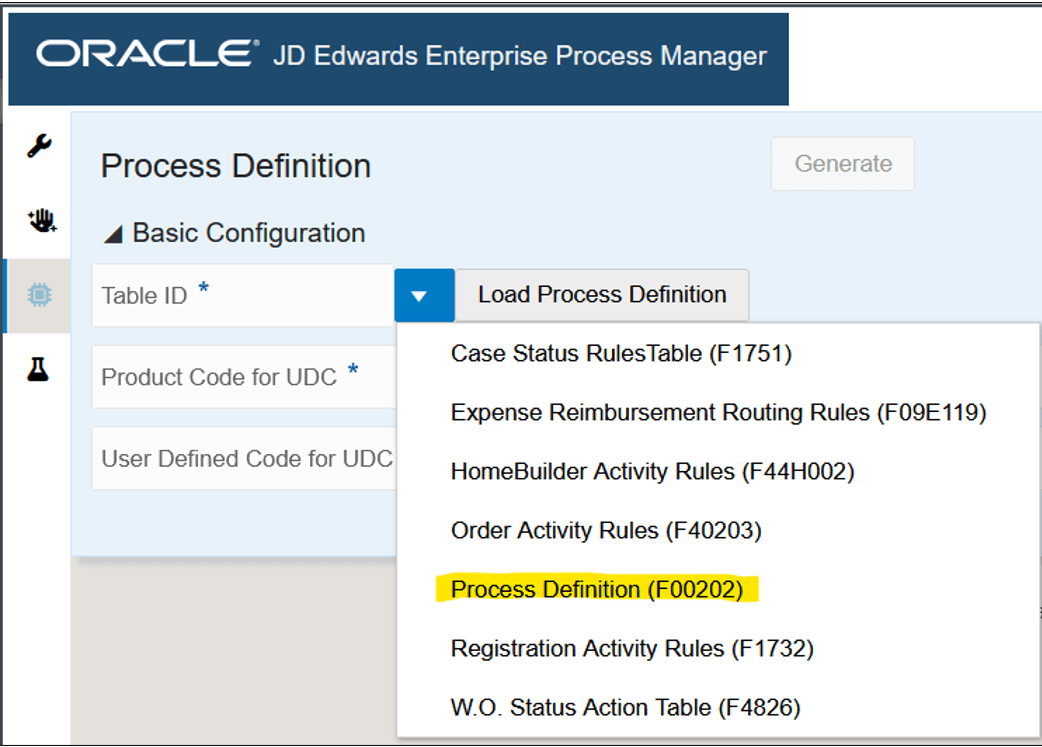
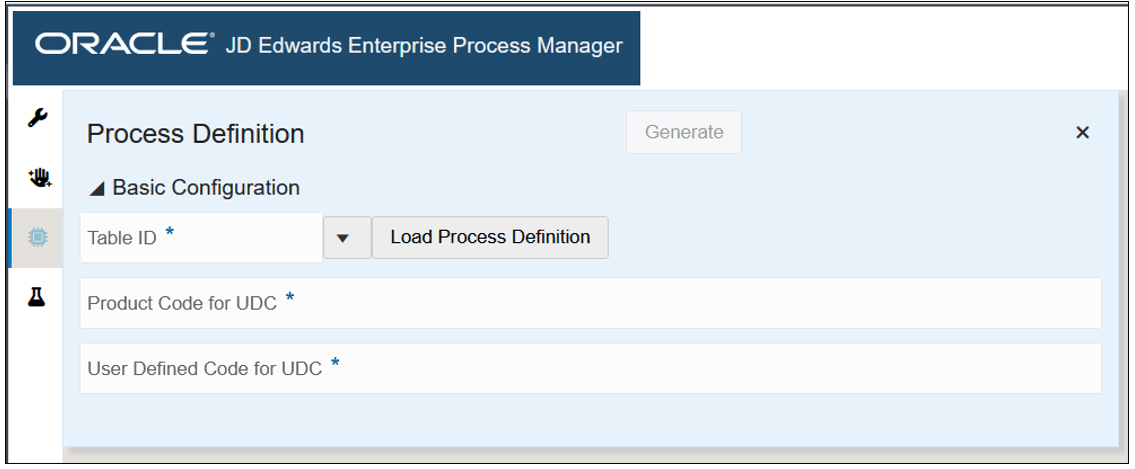
On the Process Definition pane, click the Table ID drop-down list.
The drop-down provides a list of tables in the EnterpriseOne system that contain data that Enterprise Process Modeler can use to draw process model diagrams for various application domains. For example, sales orders and purchase orders can follow Order Activity Rules as contained in table F40203.
In the scenario for this OBE, the custom process definition you created for the Lease process in the previous exercise is contained in the Process Definition table (F00202).
User-Defined Process Model -
Select Process Definition (F00202) from the drop-down list.
-
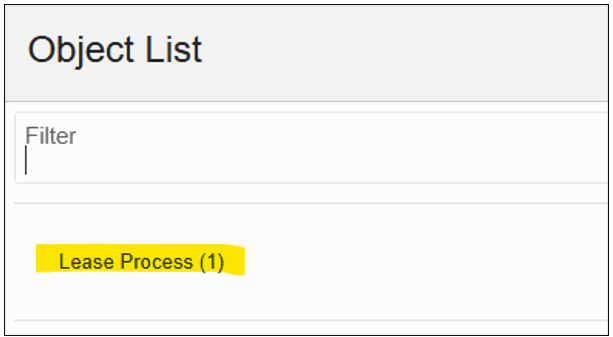
From the list of process definitions in Object List, choose the process definition you created in the previous exercise, Lease Process (x). The number in parenthesis is the unique Next Number assigned to the process definition in case the names are not unique.
Enterprise Process Manager loads the data from the Lease Process definition into the Process Definition window.
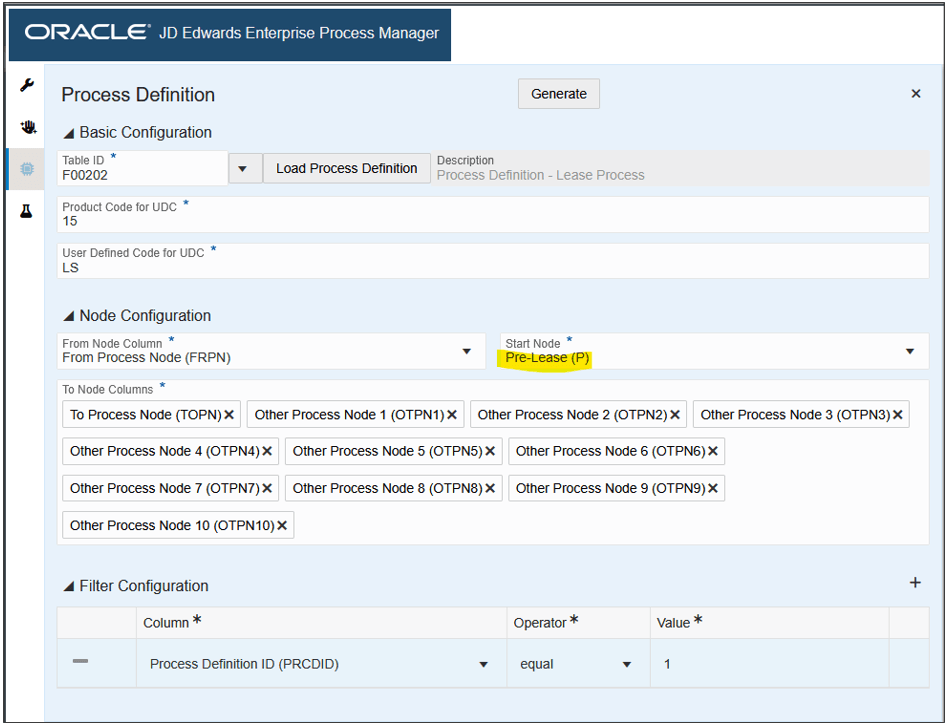
User-Defined Process Model - Process Definition Start Node -
From the Start Node drop-down, choose the first node in the Lease Process, which is the Pre-Lease (P) status.
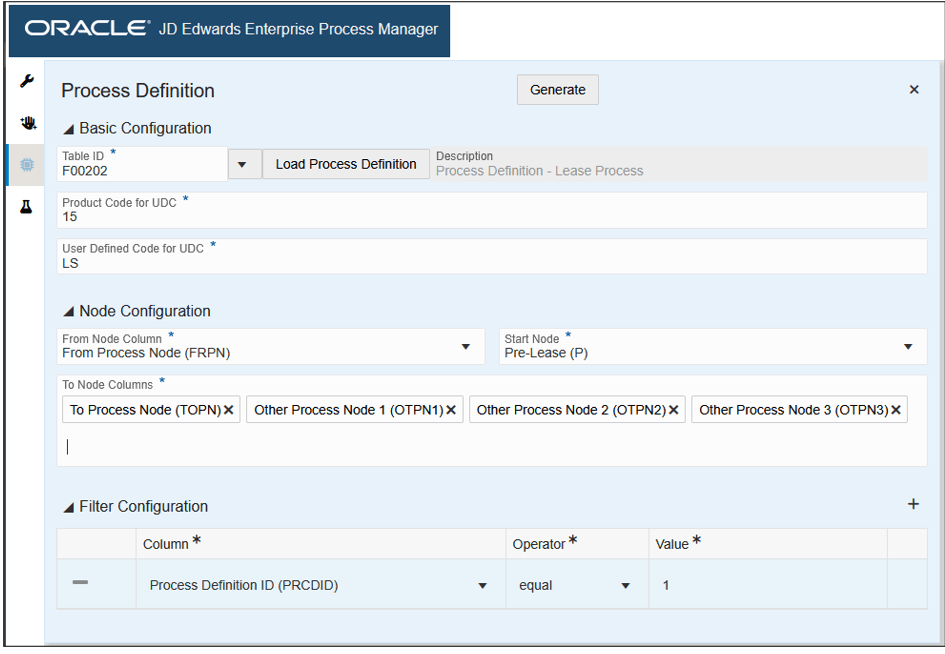
In the Node Configuration section, you also need to define the From Node Column and the To Node Columns. Enterprise Process Manager preloads these from the data in the Lease Process definition table. However, our Lease Process was not very complicated, and we only populated data as far as the Other Process Node 3 column. Other Process Node 4 through 10 are all empty.
-
Click the X icons to delete Other Process Node 4 through Other Process Node 10.
Enterprise Process Manager - Process Definition -
When the Process Definition window is configured as shown above, click the Generate button.
-
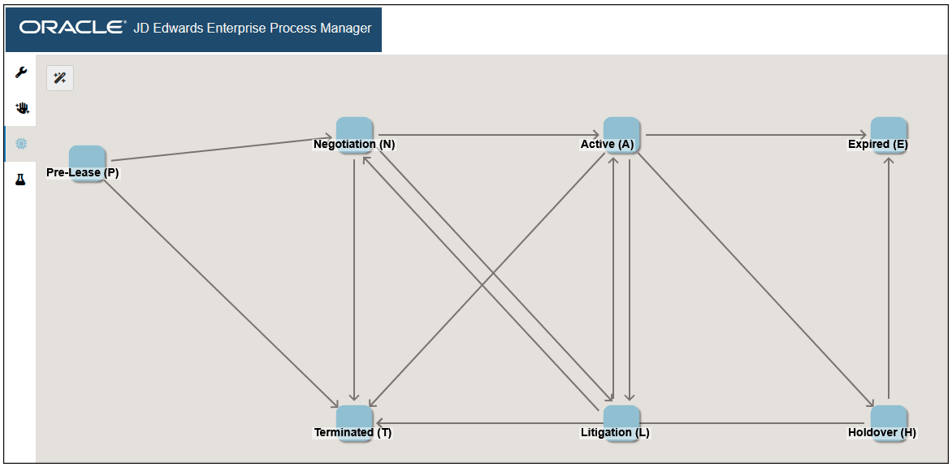
The start node is Pre-Lease (P).
-
From Pre-Lease (P), the process can flow to Negotiation (N) or Terminated (T).
-
From Negotiation (N), the process can flow to Active (A), Litigation (L), or Terminated (T).
-
And so on…
-
You can optionally drag the nodes to different locations to change the layout of the process model diagram. Any changes you make will be saved with the process model, and users will see the new layout when they open the process model. Users can also drag the nodes to suit their preferences.
-
In the Main Process Properties pane, enter a name for your process model. For example, enter
Commercial Office Lease
                  Process
.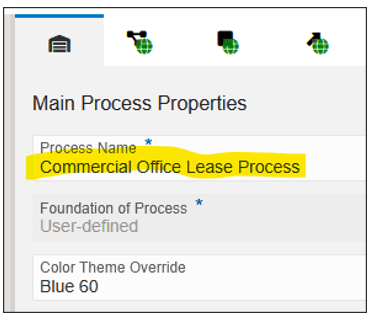
Enterprise Process Manager - Main Process Properties Tab -
Click Save and name your process as
Commercial
                  Office Lease
.
The system displays the Enterprise Process Manager window along with the Process Definition tab where you can define the basic configurations for the user-defined process.
The system displays the Object List window, listing all the process definitions in the Process Definition application. If the list is long, use the Filter field to locate the desired process definition.
Enterprise Process Manager draws the process model diagram according to the paths you configured in the Lease Process definition:
Now that you have established a process definition and generated a process model diagram, you can proceed to add metrics and analytics to your process model.
Task 4: Exploring the Enterprise Process Manager User Interface
Before proceeding to configure metrics for the nodes, let’s get familiar with a few components on the Enterprise Process Manager user interface.
-
Notice the Open Process Definition icon
 in the top-left corner of the process model
diagram. This icon opens the Process Definition tab, which you
used in the previous exercise to define the process model. You
have completed the process definition, so you won’t have to
change anything on this tab.
in the top-left corner of the process model
diagram. This icon opens the Process Definition tab, which you
used in the previous exercise to define the process model. You
have completed the process definition, so you won’t have to
change anything on this tab. -
Notice the Tool Bar on the top-left corner of the window.
Tool Bar -
Click the Design Option icon
 .
. -
Click the Data Filtering and Grouping Options icon
 .
.Data filters are similar to filters that you use in the EnterpriseOne applications, for example, the Query by Example row in grids. You can define filters, such as Company, Business Unit, or date ranges, and when users interact with this process model in Enterprise Process Modeler, they can change these filters to refine the data. Additionally, you can choose a filter to act as a “group,” which enables users to see data quickly, company-by-company or year-by-year.
At this point there are no Data Filtering and Grouping Options defined. You will define these later in this exercise.
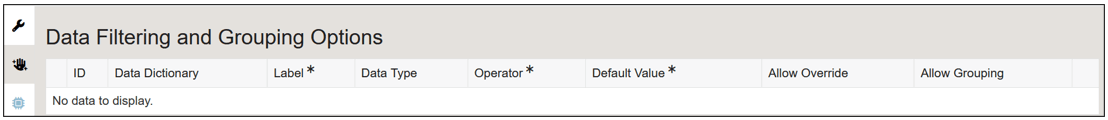
Data Filtering and Grouping Options -
Click the Preview icon
 .
.While you are in the design mode in Enterprise Process Manager, you can see a preview of the process model as users will see it in Enterprise Process Modeler.
-
Click the icon
 ,
which carries the name of your process model, “Commercial
Office Lease Process.”
,
which carries the name of your process model, “Commercial
Office Lease Process.”In this tab, you will do most of the tasks for configuring metrics and analytics.
-
On the top-right side of the window notice the four tabs:
Process Properties Tab -
The Process Properties tab
 contains essential information about your process
model, including its name (which you can edit), whether the
process model was generated from a template or user-defined, and
the color scheme (which you can change).
contains essential information about your process
model, including its name (which you can edit), whether the
process model was generated from a template or user-defined, and
the color scheme (which you can change). -
The next three tabs provide access for configuring metrics and analytics for the three contexts within the process model:
-
 Click the Process Analytics tab for access
to the tools for configuring analytics at the process level.
Click the Process Analytics tab for access
to the tools for configuring analytics at the process level. -
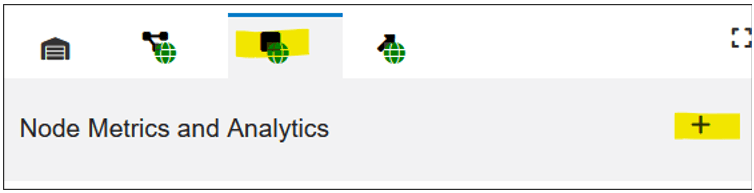
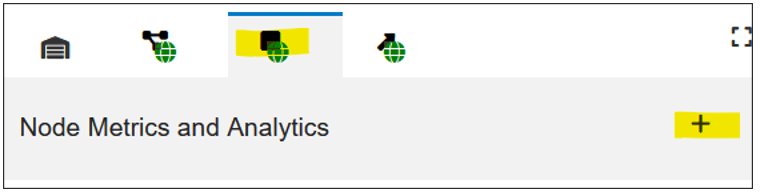
 Click the Node Metrics and Analytics tab for
access to the tools for configuring metrics and analytics at
the node level.
Click the Node Metrics and Analytics tab for
access to the tools for configuring metrics and analytics at
the node level. -
 Click the Link Metrics and Analytics tab for
access to the tools for configuring metrics and analytics at
the link level.
Click the Link Metrics and Analytics tab for
access to the tools for configuring metrics and analytics at
the link level.
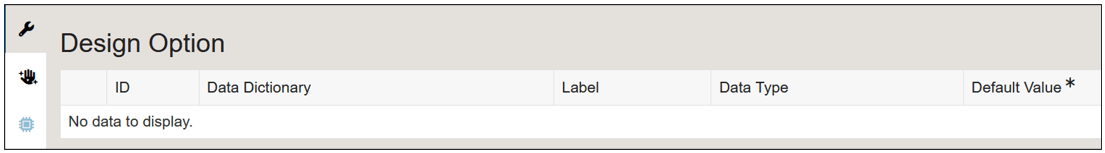
A Design Option is a filter of the data, which you define, that
provides an essential definition of the process model. In other
words, when you define a Design Option, you are setting a
characteristic of the process model that defines what the model
is—and what it is not. For example, later in this exercise you
will define a Design Option from the Lease Type field and
designate the Lease Type as “Commercial Office.” This
means that this process model applies only to Commercial Office
leases and not to any other lease type. When users interact with
this process model in Enterprise Process Modeler, they cannot
change this filter.
At this point, there are no Design Options defined. You will define one later in this exercise.
Now that you are familiar with the main components on the user interface, you can proceed to the next task: adding metrics to the nodes.
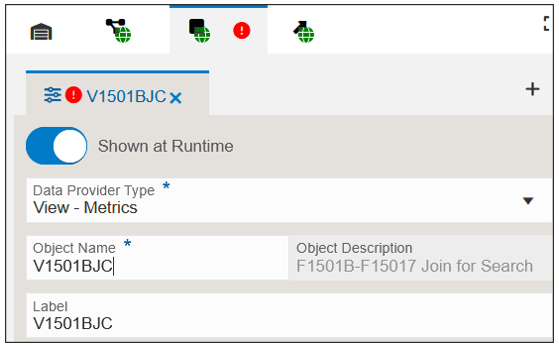
Task 5: Adding Metrics to the Nodes
Metrics are the bits of information derived from your EnterpriseOne business data, that are specific to each node or link in the process model. Metrics appear as numbers on the nodes themselves. In this exercise, you will add a metric for the count of leases at each status (node). In general, when defining metrics, you will accomplish these four tasks:
-
Identify the “data provider,” which is the EnterpriseOne table or business view where the data is stored. For this exercise, the data will come from business view V1501BJC, which is a join of the tables Lease Master Header (F1501B) and Lease Master Detail (F15017).
-
Configure filters to extract the relevant data from the data provider.
-
Configure aggregations of the data, for example, sums, counts, or averages. In this exercise, you will extract a count of the number of leases at each status.
-
Group the data so that it can be assigned to a relevant context. In this exercise, you will group the data by Lease Status so that it can be assigned to each node in the process.
-
Click the
icon to begin configuring node metrics. -
Click the Node Metrics and Analytics icon
to open the side panel for configuring node metrics. -
Click the Add Metrics or Analytic icon (+).
-
From the Data Provider Type drop-down list, select View – Metrics to create a metric from a business view.
-
In the Object Name field, enter the name of the business view that will be the data provider. Enter
V1501BJCand press Enter. -
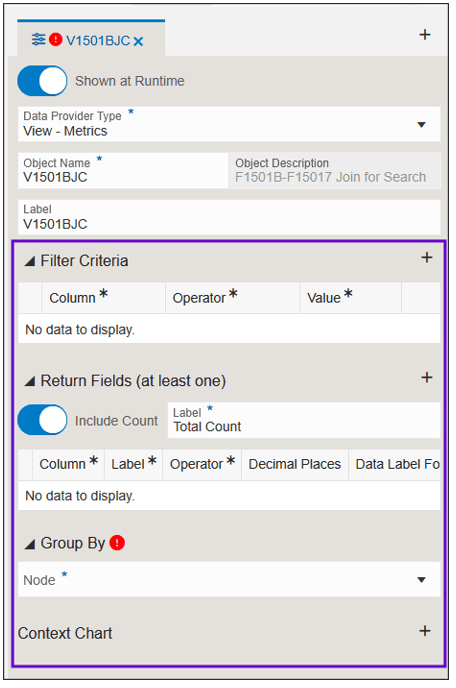
On the right side of the Filter Criteria row, click the Add Filter (+) icon.
-
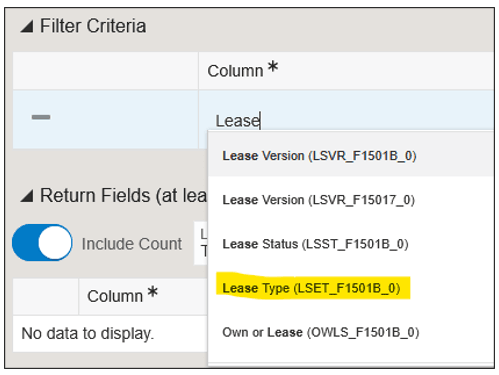
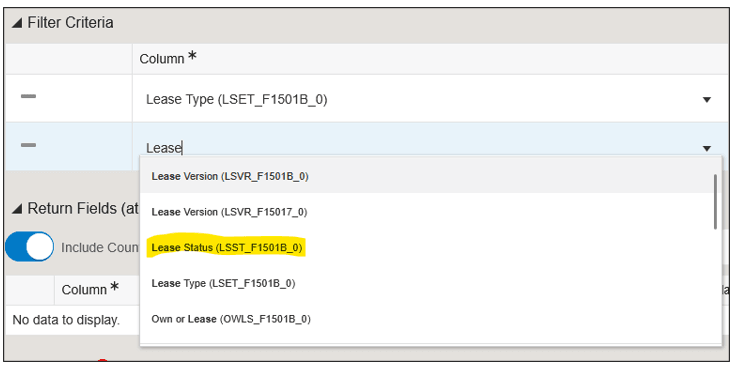
In the Filter Criteria section, click in the Column field in the first row of the table. The system displays a drop-down list with all data items in the business view.
-
The drop-down list provides type-ahead filtering. Begin typing
Leaseto view a list of all data items that begin with Lease and select Lease Type. -
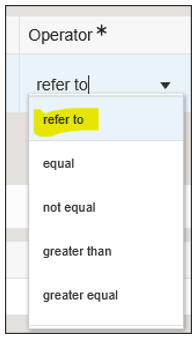
Click in the Operator field.
-
Select refer to.
-
Click in the Value field.
The system displays a drop-down list allowing you to select from Design Options and Runtime Options. However, because this is a new process model, you haven’t defined any yet. You will define the first one here. As you proceed to configure additional metrics and analytics, the Design Options and Runtime Options that you add will appear in this list.
-
Under Design Options, select (New).
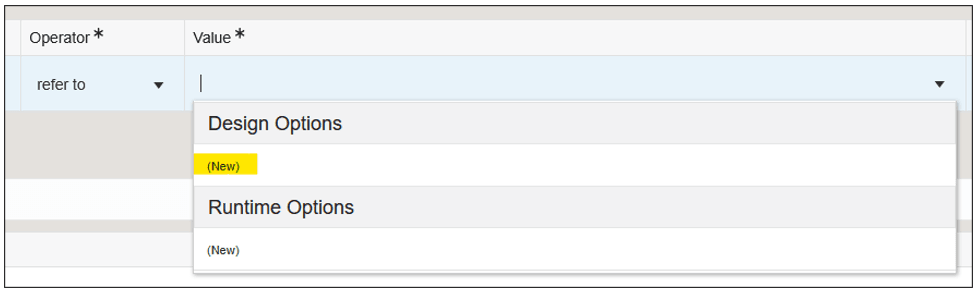
Design Options - (New) The Value field is populated with the same data item (Lease Type), which means that the value for this filter operand will be inherited from the Lease Type Design Option. Next, you will provide an actual value.
-
Click the Open Design Option icon
.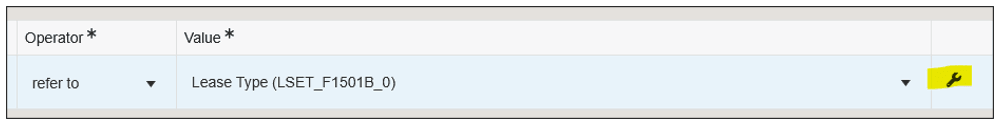
Open Design Option Icon The Design Option pane opens, providing you with a field to enter a default value for the Lease Type Design Option.
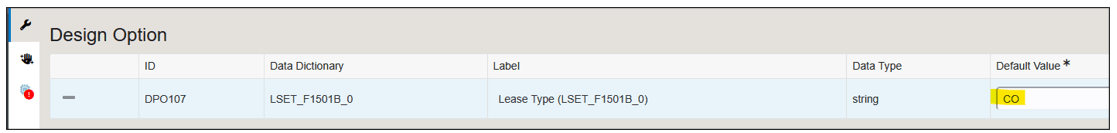
Design Option -
In the Default Value field, enter
COwhich is the value for “Commercial Office.” -
In the tool bar at the left side of the window, click the
icon to return to
the Node Metrics and Analytics tab.Note: At this point, you will see a red exclamation icon indicating that the configuration is incomplete. That’s OK.
Next you will add a filter to define the Lease Status as “is not blank.” In this way, the process model will only include data for leases that have a nonblank status assigned.
-
On the Node Metrics and Analytics tab, on the right side of the Filter Criteria row, click the Add Filter (+) icon.
-
Click in the Column field and type
Leaseto filter the list of data items. Select Lease Status. -
Click in the Operator field and select is not blank.
-
On the right side of the Filter Criteria row, click the Add Filter (+) icon.
-
Click in the Column field and type
dateto filter the list of data items for date fields. Choose Date - Beginning Effective (EFTB_F1501B_0). You might have to scroll to find it. -
Click in the Operator field and select refer to.
-
Click in the Value field, and under Runtime Options, select (New).
-
Click the Add Filter (+) icon to add another filter.
-
Click in the Column field and type
dateto filter the list of data items for date fields. Select Date - Ending Effective (EFTE_F1501B_0). You might have to scroll to find it. -
Click in the Operator field and select refer to.
-
Click in the Value field, and under Runtime Options, select (New).
-
Click the Add Filter (+) icon to add another filter.
-
Click in the Column field and type
companyto filter the list of data items for company. Select Company (CO_F15017_0). -
Click in the Operator field and select refer to.
-
Click in the Value field, and under Runtime Options, select (New).
Next, you will provide default values for the Runtime Options you just defined.
-
Click the Open Data Filtering and Grouping Options icon
in any row.The Data Filtering and Grouping Options pane opens, providing you with fields to enter default values for the Design Options, and also a setting for allowing users to override the default values at runtime, and a setting to allow grouping by that filter.
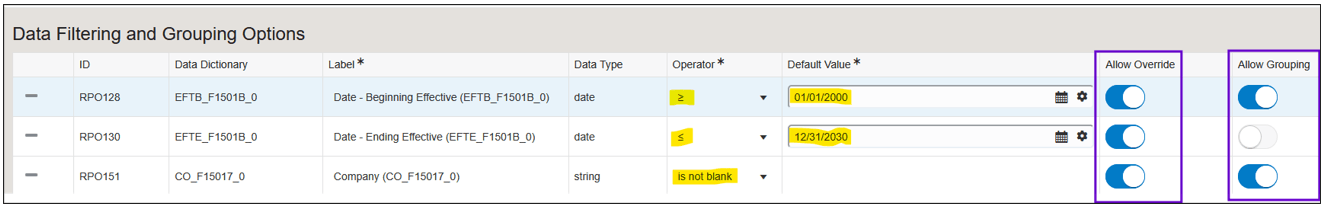
Data Filtering and Grouping Options -
Provide Default Values and set the options as shown above.
Next, you will define the data that is returned from the business view, which will be used to generate metrics on the nodes.
-
In the tool bar at the left side of the window, click the
icon to return to
the Node Metrics and Analytics tab. -
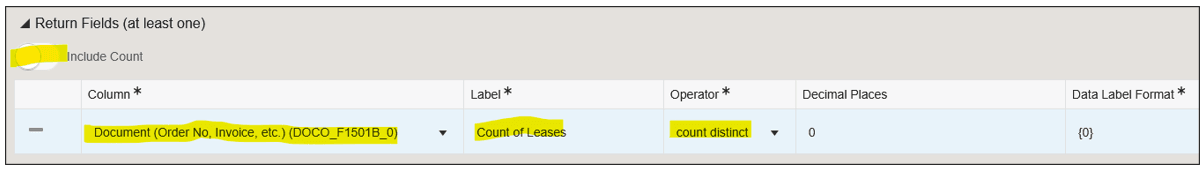
In the Return Fields section, click Add Return (+) and complete the following fields:
-
Include Count: Disable this option.
For many metrics, it is quite common to return the count of records; therefore, Enterprise Process Manager provides this option by default. However, for this scenario, leases might have multiple versions; therefore, a simple count of leases might include a count of duplicates and provide an incorrect result. Instead, we will use the count distinct aggregation (below). -
Column: Choose the column (data item) of the business view that contains the data you want to return. In this scenario we want to count the leases, so select Document (Order No, Invoice, etc.) (DOCO_F1501B_0) from the drop-down list.
-
Label: This is the name of the metric as the user will see it in Enterprise Process Modeler. By default, this is populated with the name of the data item, but you can provide a more user-friendly name. Enter
Count of
                    Leases
. -
Operator: This is the aggregation of the data you want the metric to represent, for example, a count, a sum, or an average. For this metric, select count distinct.
-
In the Group By section, click in the Node field and select Lease Status (LSST_F1501B_0).
This configuration tells Enterprise Process Modeler which data item by which to group the data so that it can be associated with each node. In this scenario, each node represents a different Lease Status.
Now the configuration for node metrics is complete.
-
Click Save.
-
Click the Preview icon
to see your
process model diagram.
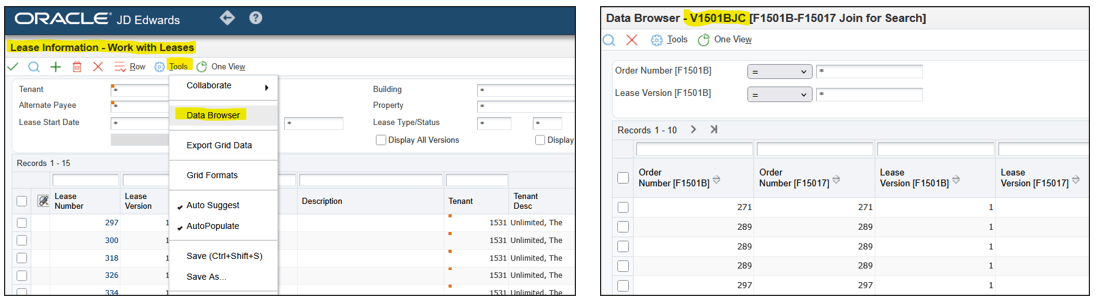
Hint: If you are researching and analyzing data for your process model using EnterpriseOne applications, for example, in this scenario you might be looking at Lease Information (P1501), and you want to know which business view the data is coming from, you can click Tools > Data Browser to open Data Browser with the business view for that form.
The Label field is auto populated with the same value as the Object Name field. You can override the value in the Label field. The system displays the value in the Label field as the name of the Node Metrics and Analytics tab.
The system also displays the Filter Criteria, Return Fields, Group By, and Context Chart sections on the Node Metrics and Analytics tab.
Hint: You can drag the left edge of the panel to
expand it horizontally or click the Maximize
icon  to expand
the panel to full screen.
to expand
the panel to full screen.
The system displays a drop-down list with a list of common criteria comparison operators. At this point you could choose a common operator, such as “equal,” and provide an explicit value for the right operand (Value). However, notice that there is also a special operator called “refer to.” This operator allows you to inherit the right operator from a Design Option or a Runtime Option. Also, at this point you can add new Design Options and Runtime Options.
What you have just done by defining a Design Option for Lease Type and setting that value to Commercial Office (CO) is to define this process model as only for Commercial Office leases. Data for all other lease types will be excluded, and users cannot change this value. That is why we gave this process model the name “Commercial Office Lease Process” earlier.
Next, you will add three additional filters, this time as Runtime Options, which users will be able to change.
The Return Fields section should be configured like this:
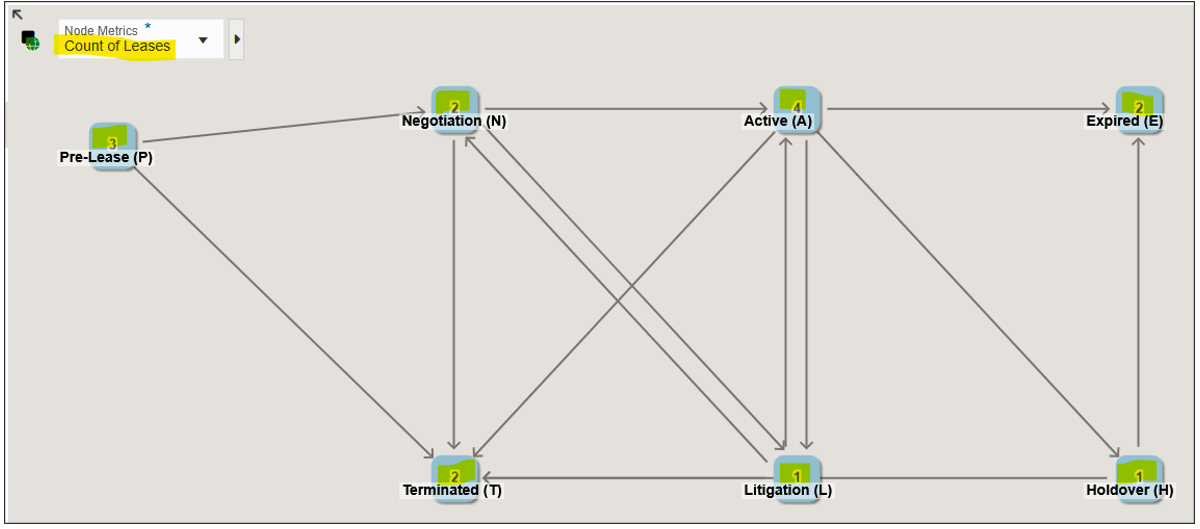
Notice that the nodes now have metrics inside the boxes, representing the count of leases at (grouped by) each Lease Status. The name of the metric is “Count of Leases,” which you provided in step 34.
Task 6: Adding a Node Context Chart
A node context chart provides a graphical visualization (chart) of a further breakdown of the data at each node. In this exercise you will create two node context charts: one to show the tenants at each status, and another to show the unit types at each status.
-
Click the
icon to begin configuring node metrics. -
Click the Node Metrics and Analytics icon
to open the side panel for configuring node metrics. -
On the Context Chart row, click the Add Context Chart (+) icon and complete the following fields:
-
Groups: Click the drop-down list and type
AN8; then select Address Number (AN8_F1501B_0) from the list. In the Lease Information application, AN8 is the data item that represents the tenant. -
Chart Name: By default, the chart name is the same as the data item you selected for Groups. Users will see this Chart Name, so you should add a user-friendly name. Enter
Tenants by Lease Status. -
Click the Add Context Chart (+) icon and complete the following fields:
-
Groups: Click the drop-down list and type
Unit
                    Type
; then select Unit Type (UTTY_F15017_0). -
Chart Name: Add a user-friendly name. Enter
Unit Type by Lease Status. -
Click Save.
-
Click the Preview icon
to see your
process model diagram with the new node context charts. -
Click on each node to see the charts for that specific node context. Your charts might look different depending on the data in your system.
Note: The charts you see in this case are bar charts. When the aggregation operator is sum or count, the system typically displays a pie chart, as these aggregations represent parts of a whole. However, if the data includes negative values, a pie chart is not appropriate, so a bar chart is used instead.
For other aggregation operators, such as count distinct, average, max, and min, the system uses a bar chart. In these cases, a gray reference line is included to indicate the aggregation value, providing a clearer visual representation for comparison. In the previous exercise, you chose count distinct as the aggregation operator; therefore, the chart is rendered as a bar chart. -
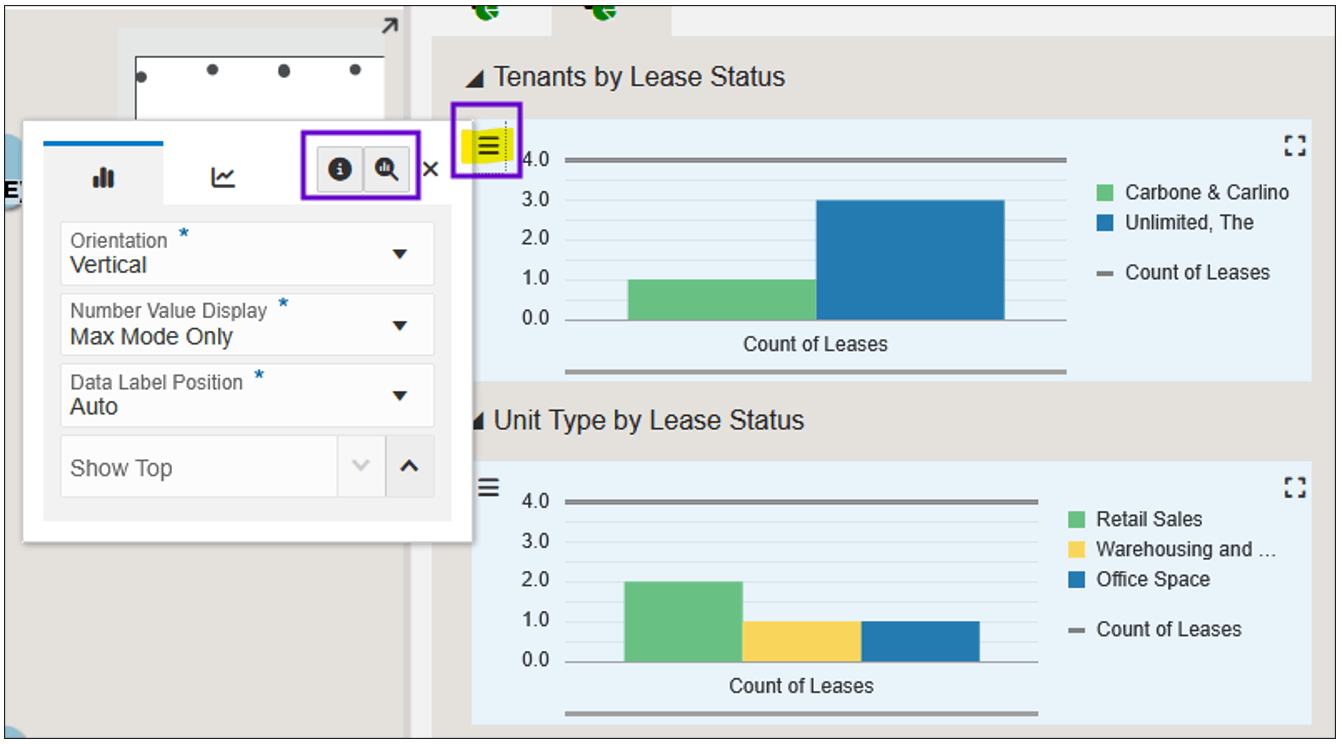
There are four leases at the Active (A) status.
-
Of those four leases, one is for tenant “Carbone & Carlino,” and three are for tenant “Limited, The.”
-
Of those four leases, two are unit type “Retail Sales,” one is “Warehousing and Storage,” and one is “Office Space.”
-
On each chart, you can click the Configure icon
 , then select Show
Query Details and Drill into Data
to see the data that generates these charts.
, then select Show
Query Details and Drill into Data
to see the data that generates these charts.You can also double-click or right-click on a bar in the chart to view the query details and underlying data for that specific chart element.
Configure Window
You can leave the other options with their default values or change them to experiment with them.
Next, let’s add another context chart to show the unit type at each status.
You can leave the other options with their default values or change them to experiment with them.
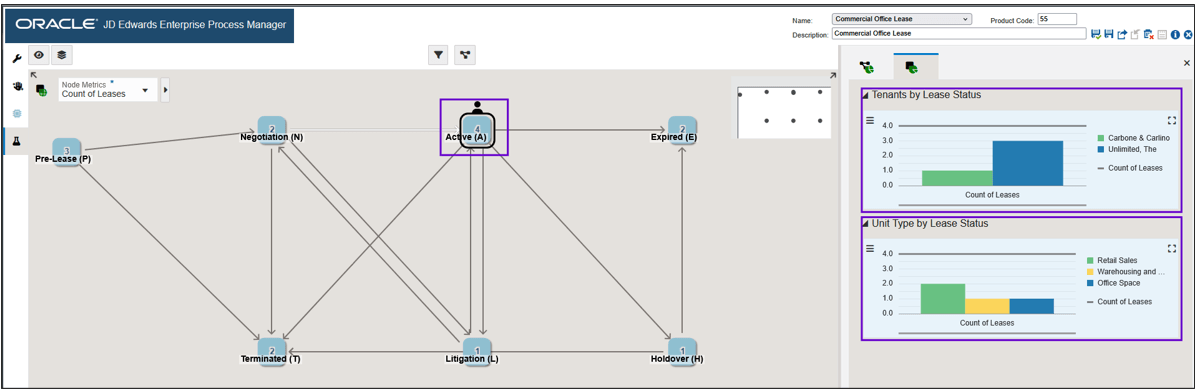
This process model diagram and node context charts now give you the following information:
Task 7: Adding Link Metrics and Context Charts
Just as nodes can have metrics and context charts associated with them, so can links (the arrows between the nodes).
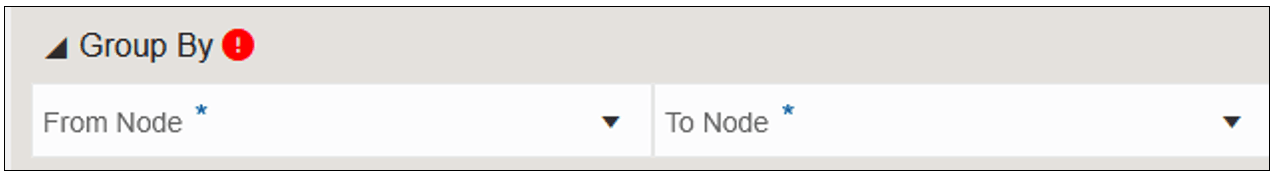
The steps for configuring link metrics and context charts are similar to the steps you followed in the previous exercises for node metrics and context charts. However, the one difference is that links require two grouping data items: one to define the start of the link and another to define its end. When you configure the data items to define the link context, Enterprise Process Manager presents you with two Group By fields: one for the From Node and another for the To Node.
The business process for which you are creating a process model must have data items that can correspond to the From Node and To Node of its links. For example, if an Order-to-Cash process is designed to track the status of sales orders, then you could use the Last Status and Next Status data items to define the From Node and To Node of the links.
For the scenario in this OBE, we are using Lease Status to define the nodes of the process; however, leases do not have an equivalent to Last Status and Next Status. Therefore, we cannot create link metrics and context charts in this scenario.
Task 8: Adding Process-level Analytics
Analytic charts do not have to have a filtering element that ties them to the context of a node or link. Some analytics might simply exist to visualize data at the process level. For the data provider, analytics can get their data from tables, business views, orchestrations, or logic extensions. In this exercise you will create an analytic chart at the process level to show the aggregation (sum) of lease billings by charge type.
-
Start by clicking the
icon to begin configuring analytics. -
Click the Process Analytics tab, then click the Add Metrics or Analytic icon (+).
-
From the Data Provider Type drop-down list, select Table – Analytic.
-
In the Object Name field, enter
F1511Band press Enter. This is the Lease Billings Master table. -
On the right side of the Filter Criteria row, click the Add Filter (+) icon.
-
In the Filter Criteria section, click in the Column field and type
Currencyto filter for Currency Code and select it. -
Click in the Operator field and select refer to.
-
Click in the Value field and under Runtime Options select (New).
-
Click the Open Data Filtering and Grouping Options icon
.The Data Filtering and Grouping Options pane opens, showing all the filters you created in the previous exercises, and a new row for Currency Code.
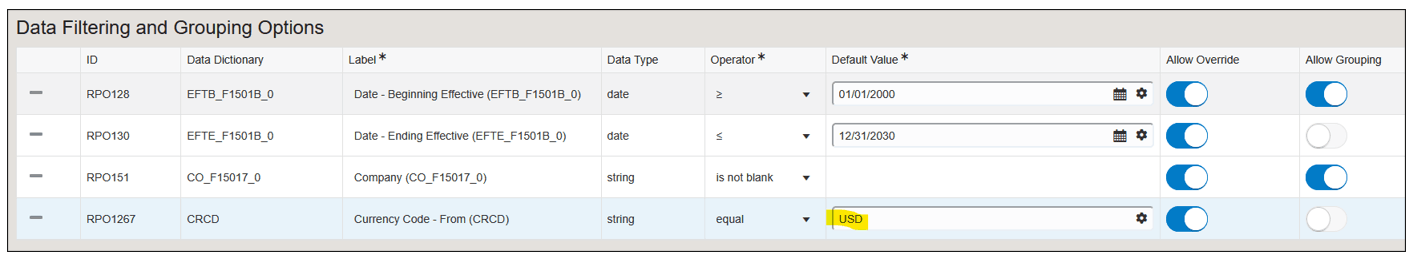
Data Filtering and Grouping Options -
In the Default Value field for Currency Code, enter
USD. -
In the tool bar at the left side of the window, click the
icon to return to
the Process Analytics tab. -
On the right side of the Filter Criteria row, click the Add Filter (+) icon.
-
In the Filter Criteria section, click in the Column field in the second row and type
Companyto filter for Company (CO) and select it. -
Click in the Operator field and select refer to.
-
Click in the Value field and under Runtime Options select Company (CO_F15017_0).
Note: In a previous exercise you added Company as a Runtime Option, which is why you see it listed again here. Selecting refer to and selecting Company here means that the value for this filter field will be inherited from the Filter Options, for which you provided default values, and for which you can allow users to change. For example, if a user chose to change the value for Company, then all metrics and analytics that you configure as refer to > Company will be filtered by that value. In general, that is a good practice, because if a user specified a particular company, he would expect to see data for all metrics and analytics to be filtered for that company.
-
In the Return Fields section, turn the Include Count option off.
-
Click the Add Return (+) icon.
-
Click in the Column field and type
Amountto filter for Amount – Gross (AG) and select it. -
Click in the Operator field and select sum.
-
Click in the Data Label Format field and edit the cell like this:
${0} USD.This field allows you to add some formatting to the value that will appear on the chart. The {0} is a placeholder for the numerical value that will appear. By adding $ before it and USD after it, you have formatted the value so that a value of “100” will appear as “$100 USD.”
The Return Field row should be configured like this:
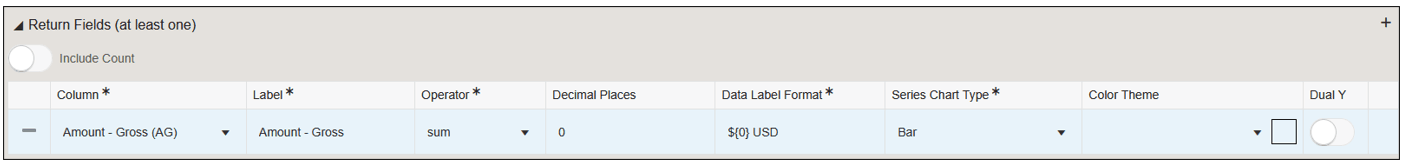
Return Fields -
On the Context Chart row, click the Add Context Chart (+) icon.
-
Click the Groups field and type
Descriptionto filter for Description (DL01) and select it. -
Click the Chart Name field and edit it to say:
Gross Billing by Charge Description. -
Click the Orientation field and select Horizontal.
-
Click the Data Label Display field and select Always.
-
Click the Sort By field and select Amount – Gross.
This section should be configured like this:
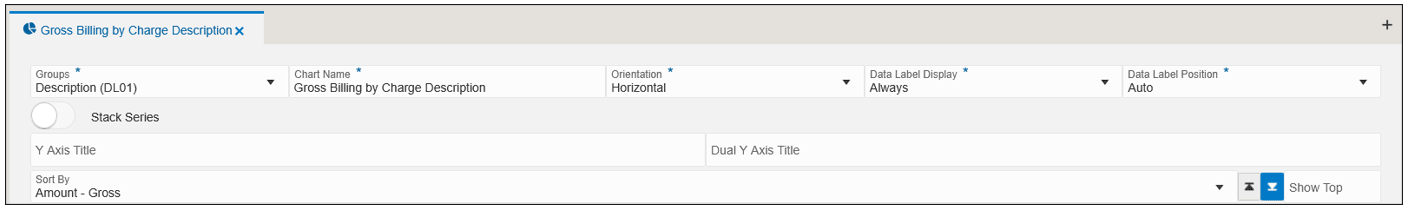
Gross Billing by Charge Description -
Click Save.
-
Click the Preview
icon to preview your process model. -
Click the Process Analytics tab to see your Gross Billing by Charge Description analytic chart.
Hint: Click the Maximize icon
to see the
chart in maximized view.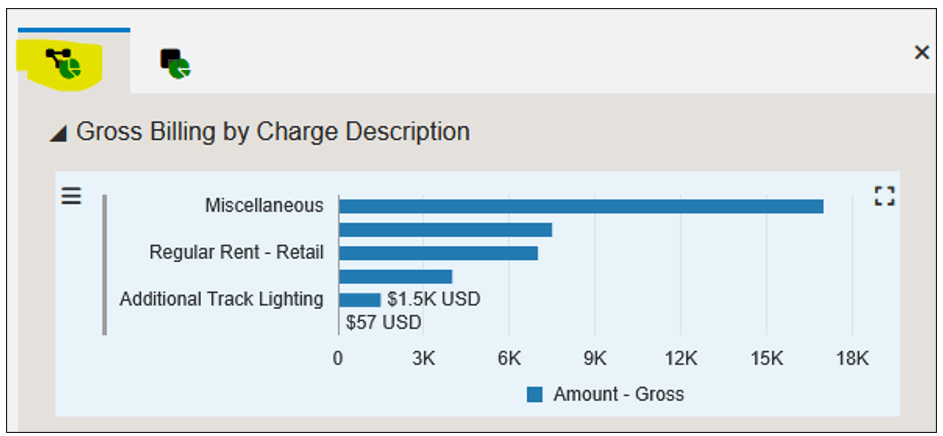
User-Defined Process Model - Process Analytics Tab Your process model is now complete. In the next exercise you will open it in Enterprise Process Modeler (“runtime” mode) and view it as a user would.
-
Click Save to be sure you have saved any recent changes.
-
Click the Close
 icon to close
Enterprise Process Manager.
icon to close
Enterprise Process Manager.
Task 9: Viewing the Process Model in Enterprise Process Modeler
In the previous exercises you acted as a process model designer and used the Process Definition application (P00201) and Enterprise Process Modeler to configure a process model, metrics, and analytics. In this exercise, you will use Enterprise Process Modeler to interact with the process model as a user, such as a business process owner, would.
-
Begin at the EnterpriseOne web client Home page.
-
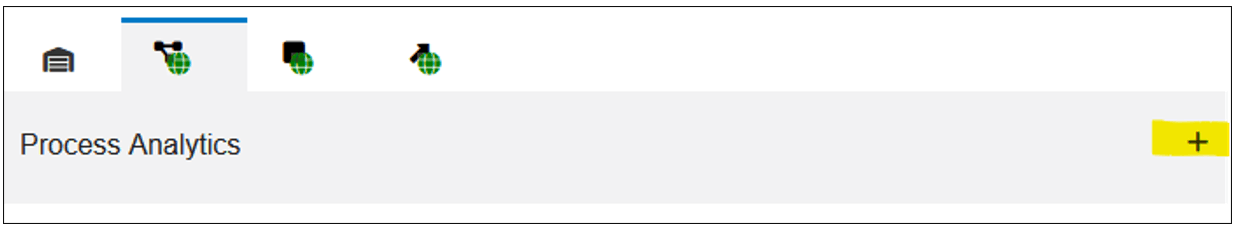
From the User menu, click Enterprise Processes. The system displays the Enterprise Process Modeler.
-
If your Commercial Office Lease Process is not displayed, select it from the Select Process drop-down list.
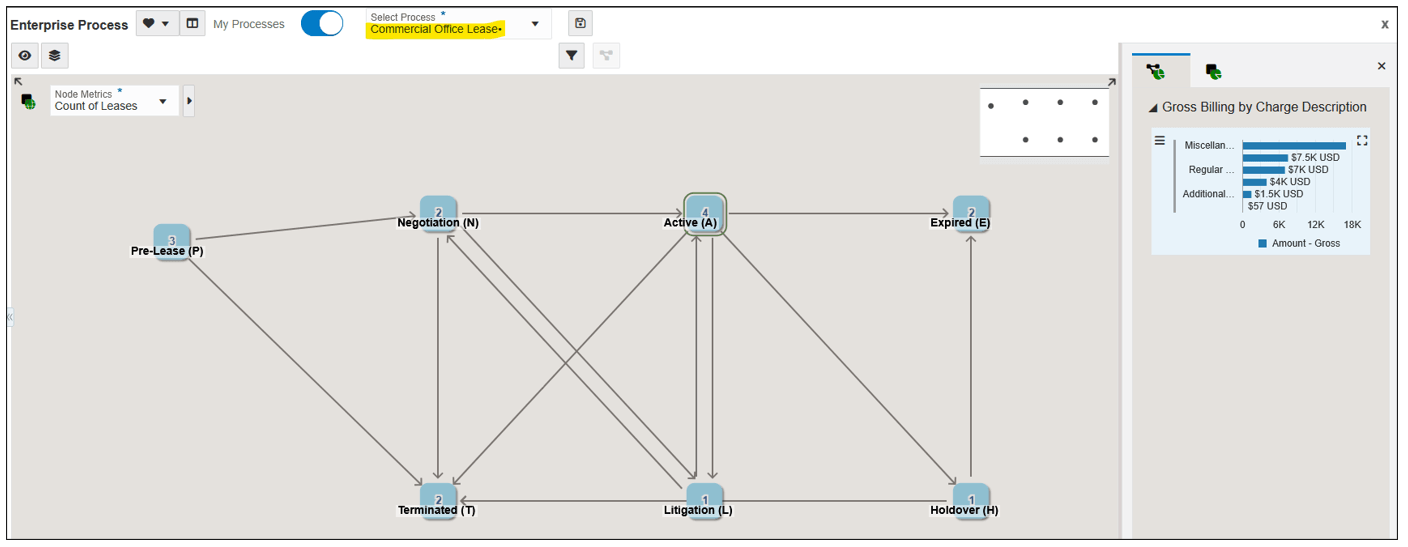
User-Defined Process Model - Select Process Notice that the process model opens in the “Process” context, and your Gross Billing by Charge Description chart opens in the Analytics pane.
-
Click a node on the process model diagram, for example, click Active (A).
Notice that the context changes to the “Node” context, and your node context charts appear.
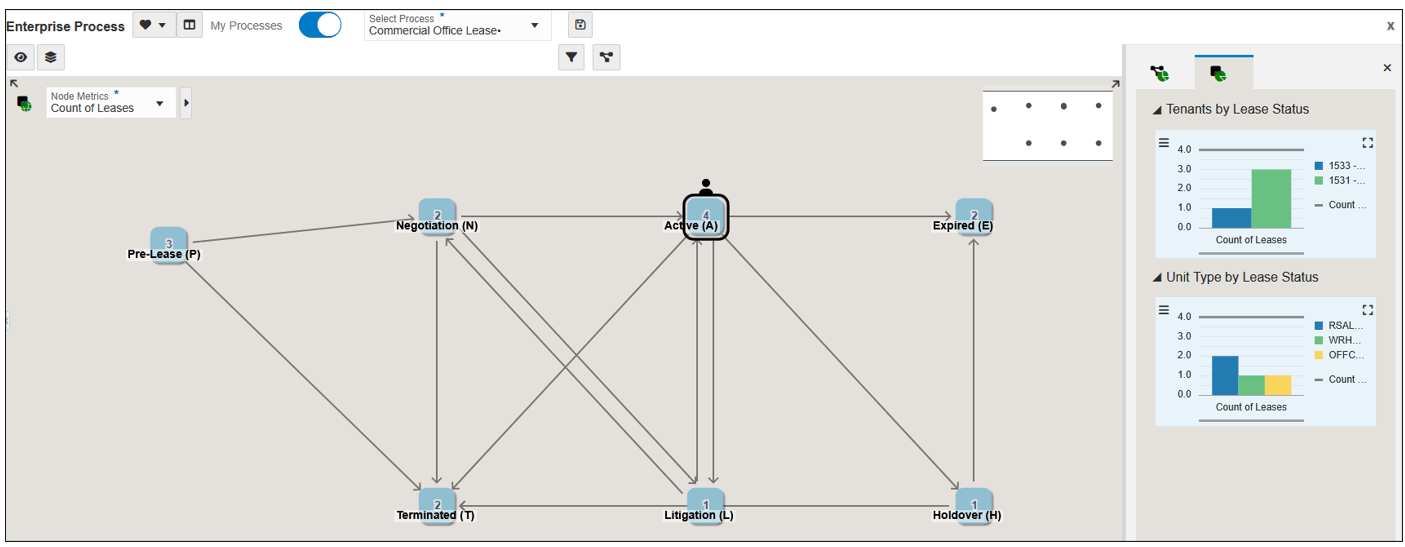
User-Defined Enterprise Process Model -
Click the Show Filter Options
 icon.
icon.The Override Filters pane appears, showing the Runtime Options (filters) that you configured in the previous exercises.
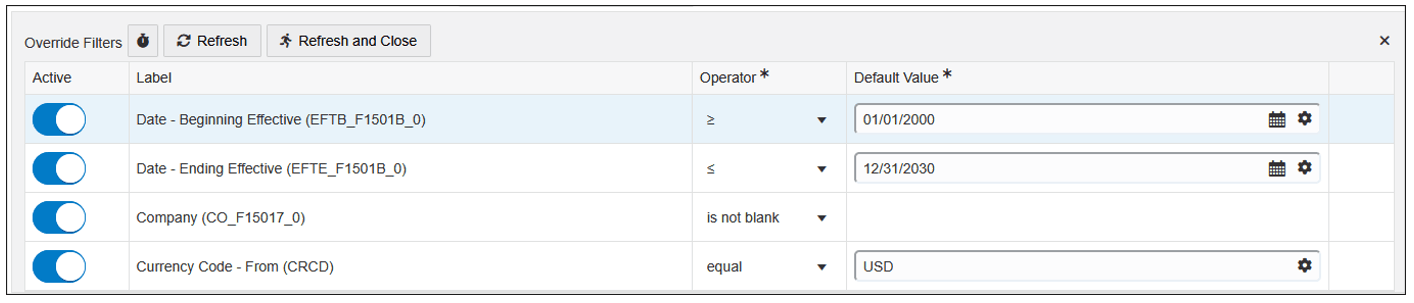
Filter Options -
Experiment by changing the values in the Default Value fields, then click Refresh or Refresh and Close to see how the filters affect the process model, metrics, and charts.
Note: Depending on the data in your system, changing the filter values may have no effect, or may result in no data being displayed. For example, in the demo data in EnterpriseOne Trial Edition, all leases use Currency Code USD. Changing this value to anything other than USD will result in no data being returned, and the Gross Billing by Charge Description chart will disappear. The same is true for Company; in the Trial Edition demo data, all leases are associated with Company 00150.
Conclusion
Congratulations! In this OBE, you have stepped through the entire process of creating a user-defined process model, metrics, and analytics, including:
-
Using the Process Definition application (P00201) to create a process definition for the Lease process, based on Lease Status.
-
Using Enterprise Process Manager to read that process definition and draw a process model diagram of the Lease Process.
-
Defining a Design Option (Lease Type=Commercial Office) to establish the process for only Commercial Office leases.
-
Defining Runtime options for dates, Company, and Currency Code, which users can modify while interacting with the process model.
-
Configuring metrics on the nodes.
-
Configuring context analytics at the node level and the process level.
The scenario in this OBE was relatively simple, and depending on your system, the demo data somewhat limited. However, using the skills you learned in this OBE, you can create process models for other business processes, and you could configure multiple metrics, context analytic charts, and data filters for more robust scenarios.
Related Links
Creating a User-Defined Process Model
G55716-01
April 2026
Copyright © 2026, Oracle and/or its affiliates.