By Generated Positive Input Pagelet
Use the By Generated Positive Input pagelet to Analyze absence results associated with generated positive input.
This example illustrates the fields and controls on the By Generated Positive Input pagelet.
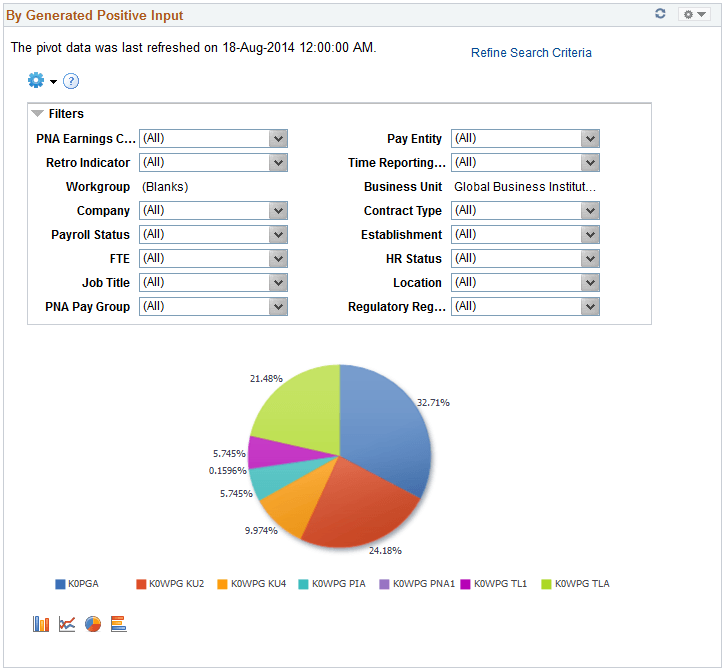
By default, this pivot grid displays a pie chart displaying the percentages of units per absence event by pay group.
| Field or Control | Description |
|---|---|
|
Refine Search Criteria |
By default, the pivot grid displays all the absence analytics data that you have loaded in your system. Click this link to access the Refine Search Criteria modal page, which enables you to analyze a smaller, refined set of data. After entering your search criteria, click Run to apply them. Click Save Criteria and Run if you want the system to apply these search criteria the next time you access the pivot grid. |