Components for Working with Analytic Grids
You design analytic grids using PeopleSoft Application Designer. In addition, you may need to work with analytic grids in the runtime environment.
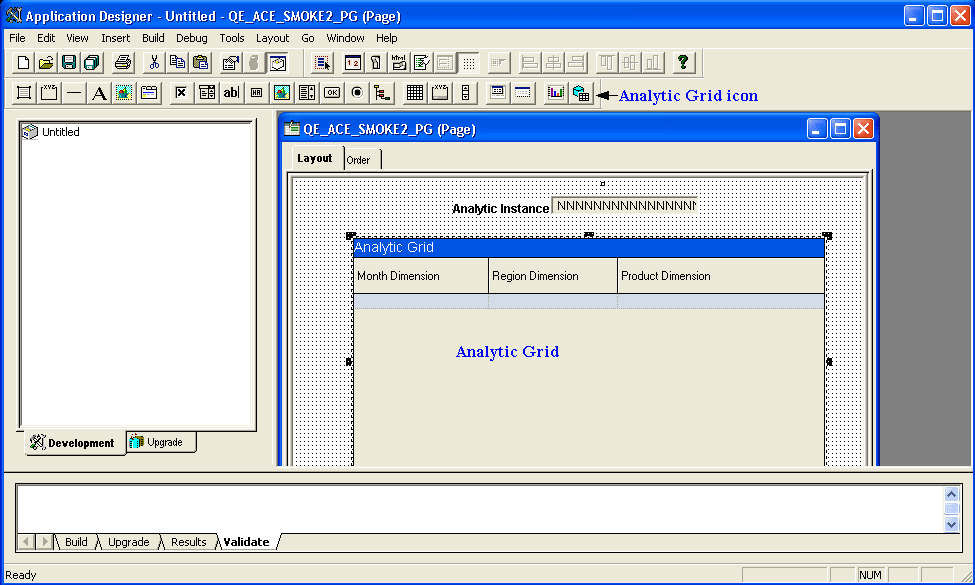
This example shows the PeopleSoft Application Designer areas used to create analytic grids.
| Term | Definition |
|---|---|
|
Analytic Grid button |
Select and then drag to insert an analytic grid into the page. |
|
Analytic grid |
Contains the grid itself. You can modify the grid's properties by double-clicking to display the Analytic Grid Properties dialog box. (Click anywhere except the column headings.) You can also double-click a grid column to display the properties box for modifying the column. In addition, you can change the order of columns on either the Layout or Order tab. |
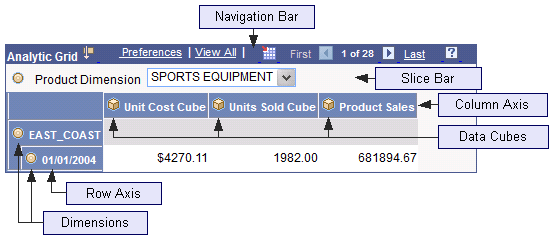
This example shows the areas in the Analytic Grid section used to modify analytic grids at runtime.
| Term | Definition |
|---|---|
|
Navigation Bar |
Enables end users to navigate through the displayed data set. Also contains a link to drag and drop instructional text. |
|
Slice Bar |
Enables end users to view selected portions, or slices, of the data, for instance, the sales of one category of product or the sales from a single region. |
|
Column Axis |
Displays the designated cubes or dimensions across the top of the analytic grid. Also contains icons for expanding or collapsing items. Note: Dimension on Column Axis can be expanded up to only four levels. |
|
Row Axis |
Displays the designated cubes or dimensions along the left-hand side of the analytic grid. |
|
Data Set |
Displays the data from the loaded analytic instance. |
See Applications User’s Guide: Understanding Analytic Grids.