Generating Charts Using Grid Data
Some grids enable you to generate a chart from grid data.
On a grid, use the View Chart button to generate a chart. When you select the View Chart button, a page displays where you configure and generate the chart.
This example illustrates the fields and controls on the View Chart page. You can find definitions for the fields and controls later on this page.
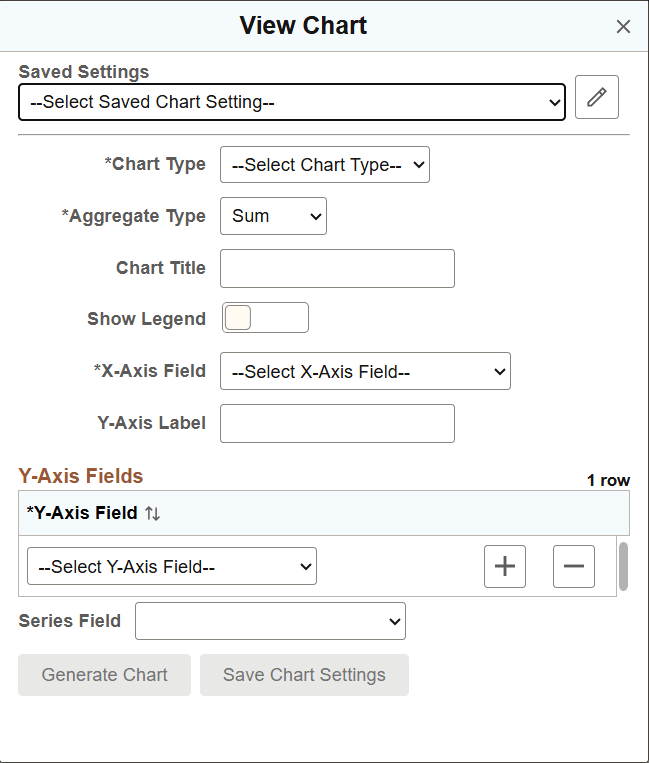
Table 5-1 Fields or controls and descriptions for the View Chart page
| Field or Control | Description |
|---|---|
|
Saved Settings |
Select a previously saved chart configuration. When you select a saved configuration, the system populates the chart options with the saved settings. |
|
Edit Saved Settings |
Rename or delete a selected saved chart configuration. |
|
Chart Type |
Select the type of chart to generate. Available chart types:
The available chart options change depending on the chart type that you select. |
|
Aggregate Type |
Select the calculation that the system uses to summarize the data. Available values are Sum, Count, and Average. Note: When you select Sum or Average, the Y-axis field must contain numeric data. |
|
Chart Title |
Enter an optional title to display at the top of the chart. |
|
Show Legend |
Select to display a legend for the chart. By default, the legend is hidden. The legend cannot be displayed when the selected Y-axis field contains non-numeric data and the aggregate type is Sum or Average. |
|
X-Axis Field or Series Field |
Select the grid column to use for the X-axis. Only eligible grid fields are available for selection. The page field label appears in the drop-down list. For more information on the X-axis field, see the X-axis and Y-axis Field Considerations table later in this topic. The label is changed to Series Field when the Pie chart type is selected. |
|
Y-Axis Label |
Enter an optional label for the Y-axis. If you select multiple Y-axis fields, entering a Y-axis label is recommended. The system displays a warning if multiple Y-axis fields are selected and no label is provided. |
|
Y-Axis Field or Value Field |
Select one or more grid columns to plot on the Y-axis. You can select up to four fields. Only eligible grid fields are available for selection. The page field label appears in the drop-down list. For more information on the Y-axis field, see the X-axis and Y-axis Field Considerations table later in this topic. The label is changed to Value Field when the Pie chart type is selected. Only one value field can be selected. |
|
Series Field |
Optionally select a grid column to group chart data into separate series. This field is available only when a single Y-axis field is selected and the chart type is not Pie. |
|
Generate Chart |
Generate the chart using the selected settings. This button is enabled only after all required fields have valid values. The chart display is hidden whenever a required field changes, indicating that the displayed chart no longer reflects the current settings. |
|
Save Chart Settings |
Save the current chart configuration for future use. Configuration names must be unique for the user and grid, and names are limited to 60 characters. Saved chart settings are private to each user, and you can save multiple configurations for the same grid. |
|
View as PDF |
Select to generate a PDF version of the chart. This button is enabled only after a chart is generated. |
Note:
Charts are generated based on current grid values, including values that have not yet been saved. Similarly, charts for tabbed grids also use the current grid values across all tabs.
When you specify the X-axis and Y-axis fields for a chart, you should note the following field considerations.
Table 5-2 X-axis and Y-axis Field Considerations
| Field | X-Axis Behavior | Y-Axis Behavior |
|---|---|---|
|
Hidden fields |
Fields on hidden tabs and hidden fields are excluded, except fields hidden through Grid Personalization. Personalized hidden fields remain available because personalization can later change field visibility. |
Same as X-axis. |
|
Non-data column fields |
Grid columns without underlying data are excluded, including HTML areas, images, push buttons, tab separators, and group boxes. |
Same as X-axis. |
|
Missing labels |
Grid columns without field labels are excluded. |
Same as X-axis. |
|
Masked fields |
Masked grid column fields are excluded. If any row for the field is masked, the field is excluded from the drop-down list. |
Same as X-axis. |
|
Label length |
Labels longer than 60 characters are truncated because the X-axis fields on the chart are limited to 60 characters. |
Same as X-axis. |