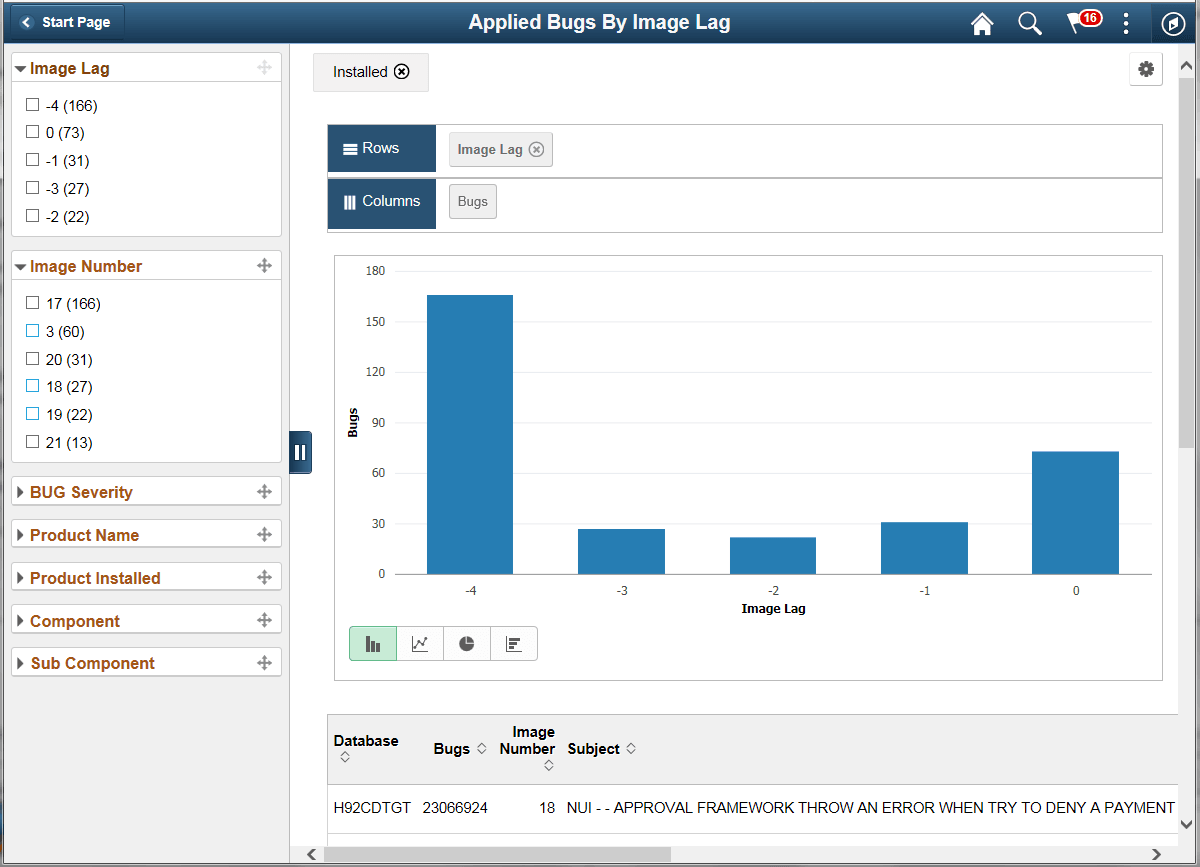
Applied Bugs by Lag Image
This pivot grid describes the relative time to apply fixes in the system. This analytic shows the difference between when the change is delivered versus when the change is applied. If a bug is delivered in PI 15 and the customer applies the bug in PI 15, then it is 0. If the customer does not apply the bug until PI 16, it will show as -1.
Note:
If you upgrade your 9.1 application to an image point, for example PI 20, no data for lag time will be available because there will not be any applied packages defined in the database.
This example illustrates the fields and controls on the Applied Bugs by Lag Image. In this example, the current PI is 21 (0). For the bugs you have applied using PI 21, you can see the PI when the bug was available, image 20 (-1,) image 19 (-2), image 18 (-3), and image 17 (-4).