Chart Classes
-
Chart class
Use the Chart class to visually display data series in common formats, including bar charts, line charts, pie charts, bubble charts, and funnel charts.
-
ChartClientState class
The ChartClientState class is used in conjunction with the Chart class to manage and maintain user-selected data items on charts.
-
Series class
The Series class is used in conjunction with the Chart class to override the default chart type (as defined for the Chart object) for each specified data series. Using the Series class allows you to create combination (or overlay) type charts.
-
ToolTipLabel class
The ToolTipLabel class is used in conjunction with the Chart class to display custom tooltips (also referred to as “data hints” or “hover text) on charts thereby overriding the default tooltips that are automatically created from the chart data.
-
ReferenceArea class
The ReferenceArea class is used in conjunction with the Chart class to display bands of color to be drawn with the chart based on numeric values along a chart axis. For each band of color, you would create a separate instance of the ReferenceArea class.
-
ReferenceLine class
The ReferenceLine class is used in conjunction with the Chart class to display colored lines to be drawn with the chart based on numeric values along a chart axis. For each reference line, you would create a separate instance of the ReferenceLine class.
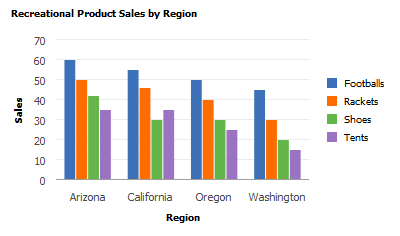
This chart was created from the Chart class with a chart type of bar:
Related Topics