Creating Spark Charts
The following example displays the five spark chart types: bar chart, line chart, area chart, line with area chart, and floating bar chart.
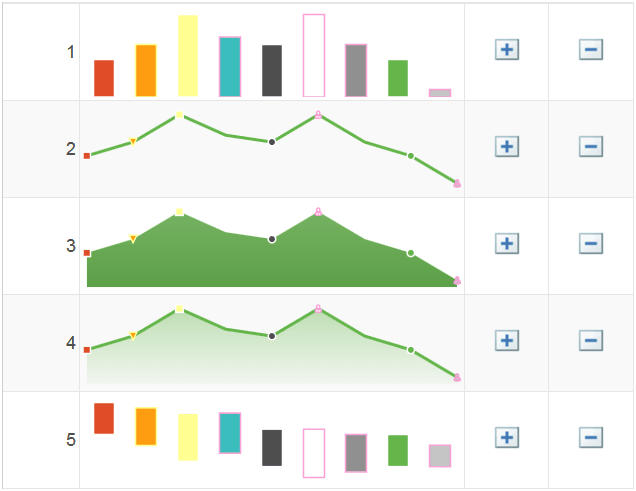
The following PeopleCode example was used to generate the preceding spark charts. The properties for each spark chart item determine its value, color, marker type, and so on.
Local SparkChart &aS;
Local SparkChartItem &aS1, &aS2, &aS3, &aS4, &aS5, &aS6, &aS7, &aS8, &aS9;

&aS = GetSparkChart(QE_DVTSCR_WRK.QE_CHRT1);

&aS1 = GetSparkChartItem();
&aS1.Value = 60;
&aS1.FloatValue = 60;
&aS1.Color = 10;
&aS1.BorderColor = 18;
&aS1.MarkerDisplayed = True;
&aS1.MarkerShape = %SparkMarker_Square;
&aS2 = GetSparkChartItem();
&aS2.Value = 70;
&aS2.FloatValue = 40;
&aS2.Color = 8;
&aS2.BorderColor = 11;
&aS2.MarkerDisplayed = True;
&aS2.MarkerShape = %SparkMarker_TriangleDown;

&aS3 = GetSparkChartItem();
&aS3.Value = 90;
&aS3.FloatValue = 10;
&aS3.Color = 11;
&aS3.BorderColor = 18;
&aS3.MarkerDisplayed = True;
&aS3.MarkerShape = %SparkMarker_Auto;
&aS4 = GetSparkChartItem();
&aS4.Value = 75;
&aS4.FloatValue = 25;
&aS4.Color = 2;
&aS4.BorderColor = 9;
&aS4.MarkerDisplayed = False;
&aS4.MarkerShape = %SparkMarker_Diamond;

&aS5 = GetSparkChartItem();
&aS5.Value = 70;
&aS5.FloatValue = 0.1;
&aS5.Color = 3;
&aS5.BorderColor = 18;
&aS5.MarkerDisplayed = True;
&aS5.MarkerShape = %SparkMarker_Circle;
&aS6 = GetSparkChartItem();
&aS6.Value = 90;
&aS6.FloatValue = - 20;
&aS6.Color = 68;
&aS6.BorderColor = 9;
&aS6.MarkerDisplayed = True;
&aS6.MarkerShape = %SparkMarker_Human;

&aS7 = GetSparkChartItem();
&aS7.Value = 70;
&aS7.FloatValue = - 10;
&aS7.Color = 4;
&aS7.BorderColor = 9;
&aS7.MarkerDisplayed = False;
&aS7.MarkerShape = %SparkMarker_Diamond;

&aS8 = GetSparkChartItem();
&aS8.Value = 60;
&aS8.FloatValue = 0.1;
&aS8.Color = 5;
&aS8.BorderColor = 18;
&aS8.MarkerDisplayed = True;
&aS8.MarkerShape = %SparkMarker_Circle;
&aS9 = GetSparkChartItem();
&aS9.Value = 40;
&aS9.FloatValue = 0.1;
&aS9.Color = 6;
&aS9.BorderColor = 9;
&aS9.MarkerDisplayed = True;
&aS9.MarkerShape = %SparkMarker_Human;
&aS.Width = 200;
&aS.AspectRatio = 0.3;

&aS.AnimationDuration = 1;
&aS.AnimationType = 1;
Local integer &row;
&row = CurrentRowNumber();
Evaluate &row
When 1
   &aS.Type = %SparkChart_Bar;
When 2
   &aS.Type = %SparkChart_Line;
When 3
   &aS.Type = %SparkChart_Area;
When 4
   &aS.Type = %SparkChart_LineWithArea;
When 5
   &aS.Type = %SparkChart_FloatingBar;
End-Evaluate;

&aS.IsDrillable = True;
&aS.LineType = %SparkLine_Straight;
&aS.LineStyle = %SparkLineStyle_Solid;
&aS.barGapRatio = 0.5;
&aS.LineWidth = 2;
&aS.SparkChartURL = "www.yahoo.com";
&aS.Title = "spark title2";
&aS.Color = %ChartColor_Green;

&aS.SetSparkChartItems(CreateArray(&aS1, &aS2, &aS3, &aS4, &aS5, &aS6, &aS7, &aS8, &aS9));